
There is no single “good” average handle time (AHT). Published U.S. figures run from about 6.6 minutes for healthcare phone lines to more than 23 minutes for resolving an issue by phone, and first response times run from seconds in chat to hours in email. The right target depends on your channel, your contact mix and how you define the clock. This guide gives you the numbers that are worth citing, shows how each is built, and explains how to turn them into a target your team can hit without hurting quality.
TL;DR
- AHT is talk time plus hold time plus after-call work, divided by calls handled. Chat and email use their own versions of the formula.
- U.S. healthcare call centers averaged a 6.6-minute AHT in 2023. Cross-industry resolution time by phone was far longer, at 23.64 minutes.
- First response time (FRT) depends on channel more than on industry: chat is measured in seconds or minutes, email and tickets in hours.
- Benchmarks are context, not quotas. Compare yourself to a peer group with a similar contact mix, and to your own baseline first.
- Pushing AHT down without watching first contact resolution (FCR) and satisfaction usually creates repeat contacts, not savings.
Table of Contents
- What AHT and first response time actually measure
- How to calculate each one
- Average handle time benchmarks: what the data shows
- First response time benchmarks by channel
- Why benchmarks disagree with each other
- Speed is not the goal: pairing AHT with resolution
- Our perspective: treat AHT as a diagnostic, not a target
- How to set an AHT and FRT target for your team
- Where handle time improves in practice
- Put these benchmarks to work with Altiam CX
- FAQ
- Sources
What AHT and first response time actually measure
The two metrics answer different questions. AHT asks how long your agents spend on an interaction. FRT asks how long a customer waits before a human starts helping.
Average handle time is the average time agents spend on each contact. MetricNet’s definition of voice handle time includes talk time, hold time and after-call work. Its chat handle time includes chat time and after-chat work.
First response time is the gap between a customer’s inquiry and the agent’s first reply. Definitions differ in the details. SparrowDesk counts only the first substantive human reply and excludes automated acknowledgments. Hootsuite’s Inbox starts the clock when a conversation reaches a human agent queue. Those choices alone can move a reported number a lot.
A related metric is speed to answer. Microsoft Learn defines it as the time until a representative accepts an escalated or queued conversation, and its historical calculation excludes outbound conversations. If your dashboard mixes these definitions, you cannot compare it with anyone else’s.
How to calculate each one
Use the same formula every time and write it down. A benchmark is only useful when your number is built the same way as the one you compare it to.
Voice AHT
The standard formula is (talk time + hold time + after-call work) divided by total calls handled, as Microsoft Learn documents for voice. For chat it uses active chat time plus active wrap-up time, divided by chats handled.
A quick example: an agent handles 40 calls in a shift. Talk time totals 200 minutes, hold time 20 minutes and after-call work 40 minutes. That is 260 minutes divided by 40 calls, or 6.5 minutes per call.
Email and ticket AHT
Email behaves differently because customers are not waiting live. Zendesk notes that the email formula considers follow-up time, meaning conversing plus wait times, divided by the number of emails. Freshworks describes the same idea for tickets: conversation, wait and wrap-up time divided by items received.
First response time
The common formula is the total FRT across tickets divided by the number of tickets. Front’s 2026 guidance adds two practical points. Teams can use the median to reduce the distortion from outliers, and when SLAs apply, most B2B teams measure within business hours. A ticket that arrives Friday at 6 p.m. should not count as a 62-hour failure if your contract promises business-hour replies.
Average handle time benchmarks: what the data shows
Published AHT figures are scarce for the U.S. and uneven in quality. Here are the ones with a clear source, population and year.
| Benchmark | Figure | Source and scope |
|---|---|---|
| Healthcare call centers, AHT | 6.6 minutes | State of Healthcare Call Centers 2023, U.S. |
| Healthcare call centers, average hold time | 4.4 minutes | Same report, against a 50-second industry goal |
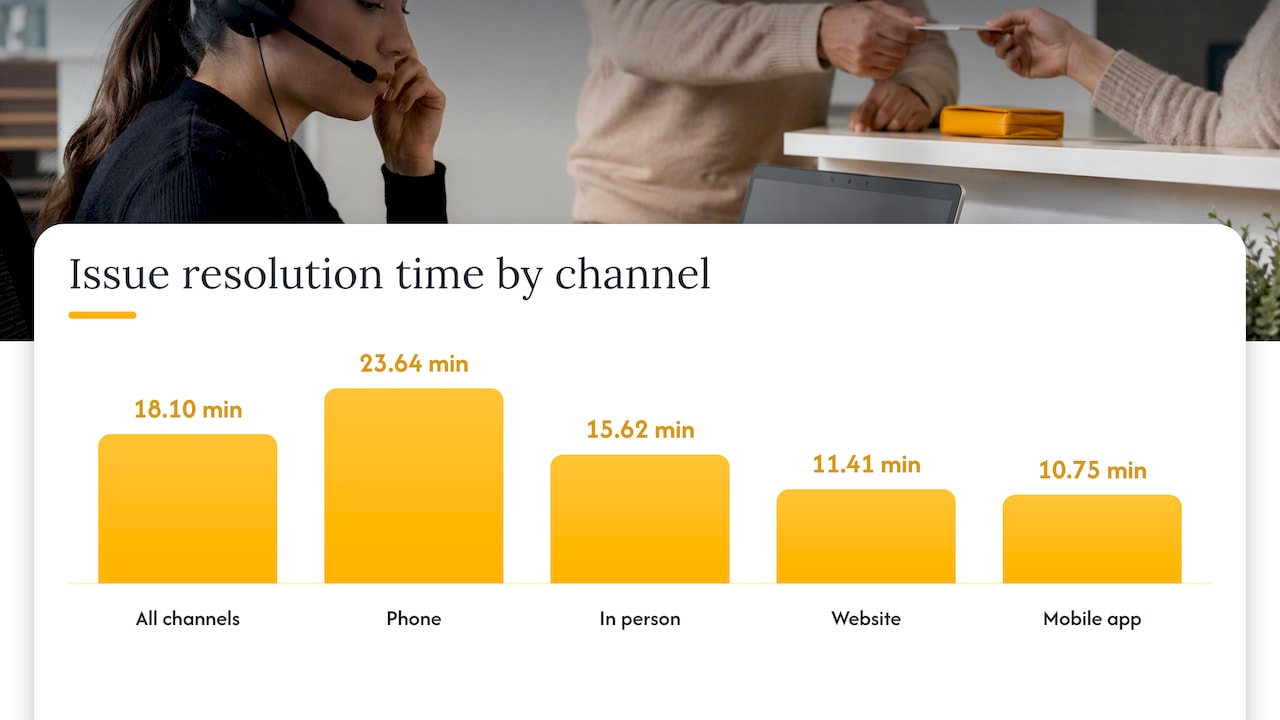
| Issue-resolution time, all channels | 18.10 minutes | J.D. Power 2023, customer-reported |
| Issue-resolution time, phone | 23.64 minutes | Same study |
| Issue-resolution time, in person | 15.62 minutes | Same study |
| Issue-resolution time, website | 11.41 minutes | Same study |
| Issue-resolution time, mobile app | 10.75 minutes | Same study |
Read the J.D. Power rows carefully. They come from a survey of 21,872 U.S. residents who contacted customer service in the prior three months, fielded May to July 2023. They measure how long customers say it took to resolve an issue, which can include several contacts, so they are not the same thing as per-call AHT. They are still useful for one reason: they show how much slower phone is than digital channels from the customer’s side.
The healthcare numbers show the gap between handling and waiting. A 6.6-minute handle time looks reasonable until you see that hold time averaged 4.4 minutes in the same report. Customers feel the hold, not the handle.
For context on holds more broadly, the 2024 Talkdesk benchmarking report put average hold time for its clients globally, including North America, at 16.9 seconds in 2023, up from 15.8 seconds in 2022. That is a different population from healthcare lines, which is exactly why you should not mix the two.
A note on rules of thumb
You will see “six to eight minutes” quoted widely as a cross-industry AHT. Treat it as a starting range for a conversation, not a standard. We have not found a rigorous, current, source-backed U.S. dataset that supports one universal number, and the research that does exist points the other way: context decides.
First response time benchmarks by channel
FRT is where channel matters most. Live channels are judged in seconds and minutes, asynchronous channels in hours.
| Channel | Benchmark | Source and scope |
|---|---|---|
| Tickets (median, U.S.) | 6 hours 20 minutes | Freshworks 2023 benchmark report, 2022 data |
| Chat (median, U.S.) | 10 minutes | Same report |
| Freshdesk tickets (all customers) | 6 hours 47 minutes | Same report, 25 industries |
| Freshchat (all customers) | 3 minutes | Same report |
| B2B Slack support | 9 minutes | 2024 State of Slack Support, Q1 to Q3 2024 |
| Live chat, typical range | 20 to 80 seconds | simpli.support benchmarks, 2026 |
| Email, typical average | 7 to 12 hours | Same page; under 4 hours for top performers |
Two things stand out. First, the same vendor reports a 10-minute chat median in one cut and a 3-minute figure in another, because the population and the way the median is taken differ. Second, the chat range of 20 to 80 seconds comes from an aggregator and is best read as directional.
For a practical read: if your email FRT is under four hours during business hours, you are in strong territory by these figures. If your chat FRT is over a few minutes, customers are likely abandoning before you reply.
FRT also pairs with service level. If you use an 80/20 target for answering calls, our guide to the 80/20 service level metric explains how it relates to staffing and queue time.
Why benchmarks disagree with each other
A benchmark is a number built for a purpose. Simpli.support lists what has to line up before you compare: the population, the clock, the channel, the segment and the decision the figure was built to support. Each of those can break a comparison.
- Contact mix. ICMI’s analysis warns that even two centers in the same industry may handle materially different contact types and customer populations. A billing line and a claims-denial line are both “healthcare” and have nothing in common.
- Definitions. Whether after-call work, transfers and holds count changes the result. So does whether the clock runs in business hours or around the clock.
- Scale and geography. MetricNet advises that a peer group should be comparable in scope, scale, complexity and geography, because public data is not normalized for your environment.
- Technology and process. TechTarget lists missing baselines, switching between industries, ignoring staffing, technology or process changes, and omitting qualitative data as the main ways benchmarking misleads.
- Staffing. The Hyro report notes that adding agents does not by itself reduce AHT. It points to better technology and workflows instead.
Speed is not the goal: pairing AHT with resolution
Lower AHT cuts cost per contact. Talkdesk makes that point, and adds that the cut should come without degrading the customer experience, for example with agent copilot tools. Dialpad warns that pushing agents to shorten calls artificially can lower the quality of care and create repeat contacts. Complex problems need time.
That is why AHT should always sit next to FCR. The Fullview 2024 benchmarks put the industry average FCR at roughly 70%, with U.S. figures of 78% for retail, 76% for insurance, 71% for energy, 71% for financial and 65% for technology. J.D. Power’s study found satisfaction scores more than 200 points higher when the issue was solved on the first contact.
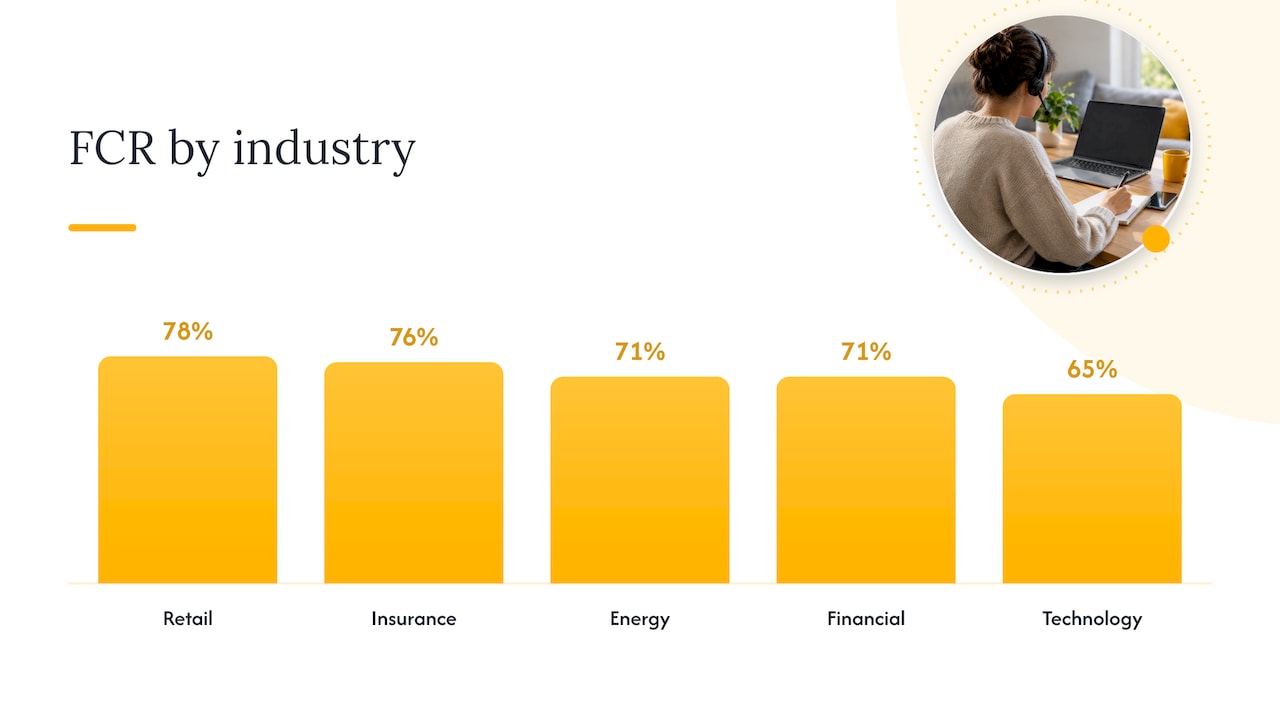
The pattern is consistent: a short call that does not solve the problem is the most expensive call you can have, because it is followed by another one. ICMI makes a related point, that operational metrics like AHT are not business outcomes in themselves and should be connected to customer and cost results.
Our perspective: treat AHT as a diagnostic, not a target
We run customer care, technical support and back-office operations for U.S. companies from nearshore teams in Latin America. Across healthcare, legal, ecommerce and financial services, the same pattern shows up. The teams that struggle with handle time are rarely slow. They are handling the wrong work in the wrong way: unclear SOPs, too many systems to open, missing context at intake, and contacts routed to the wrong person.
That is why we do not start an engagement by promising a number. We start by asking what the contact mix is, what a resolved contact looks like, and where time goes inside the interaction. A patient calling about a prior authorization and a person booking a lab appointment should not share an AHT goal.
Three principles guide how we think about it:
- Measure by contact type. One blended AHT hides the truth. Split by reason code and channel before you set any target.
- Pair every speed metric with an outcome metric. AHT goes with FCR and CSAT. FRT goes with resolution time.
- Fix the workflow before coaching the agent. Better SOPs, knowledge access and after-call automation shorten handle time without rushing anyone. We go deeper on this in our piece on cutting handling time through customer care workflows.
When a team is under pressure to hit a handle-time number, our advice is simple: protect the caller’s outcome first, and let the number follow.
— Daniela
How to set an AHT and FRT target for your team
Follow these steps to turn published benchmarks into a target you can defend.
- Lock the definitions. Decide what is in AHT (talk, hold, wrap-up, transfers) and when the FRT clock starts and stops. Document business hours versus calendar hours.
- Build your baseline. Pull at least a few weeks of data by channel and reason code. As Metrigy’s Robin Gareiss told TechTarget, without the starting point you cannot tell whether a change helped.
- Pick a true peer group. Match on contact type, scale, complexity and geography, as MetricNet advises. Use published figures like the healthcare 6.6-minute AHT only as a sanity check.
- Set ranges, not single numbers. Give each contact type a target band, and review the outliers on both ends. Very short calls often signal dropped or rushed contacts.
- Pair with quality. Track FCR, repeat contact rate and CSAT in the same view. If AHT falls and FCR falls with it, you have moved cost, not removed it.
- Review on a cycle. Reassess after process, staffing or technology changes, since each one invalidates the old baseline.
If regulated calls are in your mix, the target also has to leave room for required disclosures and documentation. Our call center compliance monitoring playbook covers how to build that into QA. For broader staffing levers, see these workforce optimization examples.
Where handle time improves in practice
Most reductions come from a short list of changes, and none requires telling agents to hurry.
- Better intake. Collecting the right details up front, before the agent opens the account, trims talk time and prevents transfers.
- Cleaner SOPs and knowledge. One searchable answer per issue beats three conflicting documents.
- Less after-call work. Templates, auto-summaries and structured dispositions reduce wrap-up, which is part of AHT in every formula above.
- Right-sized staffing. Queue time drives hold time, and hold time is what customers remember. In healthcare, the 4.4-minute average hold is a bigger problem than the 6.6-minute handle time.
- Specialized agents for complex work. Routing sensitive or technical contacts to trained teams raises FCR, even if AHT on those contacts rises.
For teams that need capacity without a long hiring cycle, nearshore models are one option. We outline how in optimizing customer care with nearshore support.
Put these benchmarks to work with Altiam CX
If your AHT or FRT is drifting and you do not have the capacity to fix it, we can help. Altiam CX provides managed nearshore teams, including bilingual agents, for customer support, technical assistance and back-office work. For healthcare organizations, our patient support and SOP management service focuses on the contacts and procedures that drive handle time. For law firms, our legal intake and inquiry handling covers intake, follow-ups and scheduling. You can also see the full range on our services page.
FAQ
What is a good average handle time?
It depends on your contact types and channels. U.S. healthcare call centers averaged 6.6 minutes in a 2023 report, while customers reported 23.64 minutes to resolve an issue by phone in J.D. Power’s 2023 study. Use those as reference points, then set your own range by reason code.
Is a lower AHT always better?
No. Cutting calls short can lower service quality and lead to repeat contacts. A lower AHT is a win only when FCR and customer satisfaction hold steady or improve.
How is first response time different from average handle time?
FRT measures how long a customer waits for the first human reply. AHT measures how long agents spend on the whole interaction, including hold and after-call work. FRT is about responsiveness, AHT is about effort and cost.
What is a good first response time for email and chat?
One 2026 aggregator puts typical live chat at 20 to 80 seconds, and email averages at 7 to 12 hours, with top performers under 4 hours. Freshworks’ 2023 U.S. medians were 10 minutes for chat and 6 hours 20 minutes for tickets. Define your clock, business hours or calendar hours, before you compare.
How do you calculate AHT for email?
Add up the conversation and wait time on follow-ups, then divide by the number of emails handled. Vendors differ on whether wrap-up is included, so pick one approach and keep it consistent.
Sources
- Hyro, The State of Healthcare Call Centers 2023
- J.D. Power, 2023 U.S. Cross-Industry Customer Service Experience Study
- MetricNet, United States PLUS sample
- MetricNet, How to benchmark
- Microsoft Learn, Calculate conversation metrics
- Hootsuite, Inbox metrics
- SparrowDesk, First response time guide
- Zendesk, Average handle time
- Freshworks, Guide to average handle time
- Front, First response time
- Freshworks, Customer Service Benchmark Report
- Pylon, 2024 State of Slack Support
- simpli.support, Customer support benchmarks
- Talkdesk, 2024 Global Contact Center KPI Benchmarking Report
- Dialpad, 15 Call Center Metrics to Track
- Fullview, First Call Resolution Rate Industry Benchmarks
- ICMI, Beware of Benchmarking
- TechTarget, Benefits and challenges of contact center benchmarking