
Service level 80/20 means 80% of inbound calls get answered within 20 seconds. That’s it. No hidden formula, no asterisk It measures how fast your team picks up the phone, not whether the call actually solved anything.
Here’s the verdict you need before diving into the mechanics: 80/20 is a useful benchmark, not a universal law. It’s an industry convention that got adopted widely because it’s easy to communicate, not because any rigorous study proved it optimal. Some queues need 90/20. Others do fine at 70/30. The right number comes from modeling your specific call patterns, not copying what a competitor uses.
This guide walks through the parts that actually matter for running a contact center on this metric:
- How to calculate it correctly, including the details most dashboards get wrong
- Why 80/20 became the default, and where it hides real problems
- Which metrics belong next to it so speed doesn’t override quality
- How to pick the right target for each queue using Erlang modeling
- The operational levers that move the number without wrecking your team
Key Takeaways
Service level 80/20 works as a benchmark only when it’s modeled against your actual call patterns and reported alongside quality metrics, not treated as a fixed universal standard.
| Point | Details |
|---|---|
| Define the metric precisely | 80/20 means 80% of calls answered within 20 seconds; confirm your inclusion/exclusion rules for abandons and IVR time. |
| Model, don’t inherit, your target | Use Erlang-based staffing math to test 80/20 against alternatives before committing budget. |
| Pair SL with quality metrics | Track ASA, abandonment rate, FCR, and CSAT alongside service level to catch speed-for-quality trade-offs. |
| Report by interval and compliance rate | Use 15 to 30 minute intervals and a compliance rate instead of a single monthly average to expose the tail. |
| Get execution support when needed | Altiamcx combines queue segmentation and Erlang modeling with disciplined nearshore staffing execution to hold targets under real volume. |
Table of Contents
- What Is Service Level 80/20 and How Do You Calculate It?
- Why 80/20 Became Standard and Where It Breaks Down
- What Metrics Belong Next to Service Level
- How to Choose the Right Service-Level Target for Each Queue
- Operational Levers That Actually Move Service Level
- Reporting Rules That Keep Service Level Honest
- How Altiam CX Applies These Principles in Real Operations
- What Contact Center Leaders Get Wrong About 80/20
- Get Modeling and Execution Support for Your Service Level Strategy
- Frequently Asked Questions
- Sources
What Is Service Level 80/20 and How Do You Calculate It?
The formula looks simple: divide the number of calls answered within your threshold by the total number of calls offered, then multiply by 100. For 80/20, the threshold is 20 seconds.
Service Level = (Calls answered within 20 seconds ÷ Total calls offered) × 100
Here’s a worked example. Say your queue receives 500 calls in a 30-minute interval. Your agents answer 410 of them within 20 seconds. You hit your 80/20 target for that interval.
The tricky part isn’t the math. It’s defining what counts as “offered” and what counts as “answered.” Get sloppy here and two contact centers reporting the same “82%” could mean very different customer experiences.
- Offered calls typically means every call that reaches the queue, including ones that later abandon. Some platforms exclude calls abandoned in the first 5 seconds, treating them as “too fast to count.” Decide this rule once and apply it consistently.
- Answered calls should mean picked up by a live agent, not routed to voicemail or a callback queue. If your IVR time counts against the clock, say so explicitly in your reporting.
- Interval length changes the picture. A daily average of 80% can mask an interval where service level dropped to 40% during a lunch-hour spike. Shorter intervals surface those swings that a daily rollup buries.
| Interval Setting | Effect on Reported Service Level |
|---|---|
| 15 minutes | Most sensitive; exposes short spikes but adds noise |
| 30 minutes | Common industry default; balances stability and detail |
| 60 minutes | Smooths volatility; can hide short but severe dips |
| Daily average | Least useful for operational decisions; good for exec summaries only |
Pick your interval based on how volatile your call arrival pattern is, not on what makes the number look best.
Why 80/20 Became Standard and Where It Breaks Down
Nobody can point to the original research that proved 80% within 20 seconds is the ideal balance point. It spread through the industry the way most conventions do: someone used it, it worked well enough, and it became the default everyone inherited without questioning. Academic reviews of contact center metrics confirm there’s no rigorous justification for those specific numbers over, say, 75/25 or 85/15.
That matters because inherited targets often stop matching your actual operation. A queue built for account inquiries doesn’t need the same urgency as a fraud alert line. Treating both the same way wastes staffing budget on one and underserves the other.
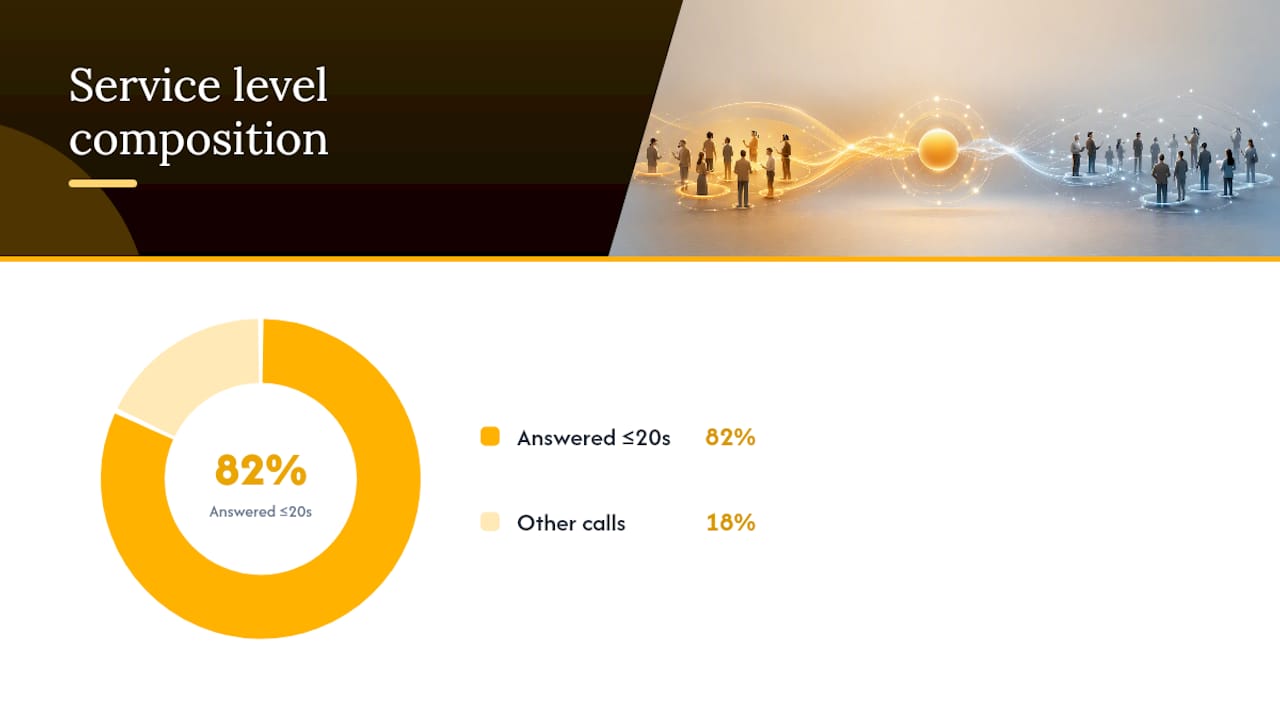
The 20% you’re not measuring can be worse than you think. An 82% service level tells you nothing about how long the remaining 18% waited. Some of those callers might have hung up after four minutes. Averages hide that tail completely.
Three problems show up constantly in real operations:
- Small SLA increases (going from 80/20 to 85/20) can require staffing increases far larger than the percentage gain suggests, because queuing math is nonlinear near capacity.
- Reporting can be gamed by excluding abandoned calls, cherry-picking intervals, or averaging across a full day to smooth out bad hours.
- Teams chase the percentage while resolution quality quietly slips, because nobody’s watching the metrics that would catch it.
Pro Tip: *Pull your service level distribution by hour of day for one full week before you touch staffing.
What Metrics Belong Next to Service Level
Service level answers one question: how fast did we pick up? It says nothing about whether the call went well. Reading SL without ASA, abandonment, FCR, and CSAT is like judging a restaurant by how fast the host seats you, ignoring the food entirely.
Average speed of answer (ASA) measures the actual average wait time across all calls, not just whether they cleared a threshold. Two queues can both hit 80/20 while having very different ASAs. One might average 12 seconds, the other 19. Both pass the test; only one is genuinely fast.
Abandonment rate tells you how many callers gave up before reaching an agent. A queue with high service level but climbing abandonment is often masking a shrinking denominator: frustrated callers hang up before the 20 second mark, artificially inflating the percentage. Look at abandonment by wait duration, not just the total count.
First contact resolution (FCR) and customer satisfaction (CSAT) guard against the most common failure mode of speed-obsessed operations: agents rushing calls to protect their SL numbers, which drives repeat contacts and complaints.
A useful dashboard snapshot pairs these four numbers side by side for every reporting interval:
- Service level percentage against target
- ASA in seconds
- Abandonment rate as a percentage of offered calls
- FCR and CSAT scores for the same period
When service level climbs and FCR drops in the same window, you’re not improving. You’re trading one problem for another.
How to Choose the Right Service-Level Target for Each Queue
Copying 80/20 across every queue in your operation is the single most common mistake CX leaders make. A billing question and a service outage report don’t carry the same urgency, and treating them identically wastes resources in one direction and risks churn in the other.
Here’s the process that actually produces defensible targets:
- Segment queues by intent, urgency, and value. Split calls into categories like sales, technical escalations, billing, and general inquiries. A queue tied to revenue capture (a customer trying to buy or upgrade) usually warrants a tighter target than a routine status check.
- Model staffing needs with Erlang C. This is the standard workforce management math for translating call volume and average handle time into required agent counts at a given service level. Erlang-based modeling uses interval-level arrival rates and shrinkage-adjusted staffing counts to show you exactly how many agents you need for 80/20 versus 85/20 versus 75/25 on a given queue.
- Run the cost comparison before committing. Moving from 80/20 to 90/20 might sound like a modest improvement, but the staffing math behind it is rarely linear. Model the marginal agent cost of that jump against the business value of the faster answer.
- Build a decision checklist covering caller patience (how long will this segment tolerate waiting before abandoning), revenue impact (does a slow answer cost a sale), acceptable abandonment rate, and labor cost per seat for the shift patterns required.
- Document the reasoning, not just the number. When you present a target to finance or executive leadership, show the Erlang inputs, the segmentation logic, and the tradeoffs considered. A defended target survives budget season. An inherited one gets cut the first time costs come under pressure.
Seeing the service level swing at each level makes the staffing conversation with finance concrete instead of abstract.*
COPC’s guidance on service level measurement reinforces this: treat targets as ranges to refine over time, not fixed numbers inherited from a template. A target set two years ago on different call volumes and staffing costs is probably wrong for your queue today.
Operational Levers That Actually Move Service Level
Once you know your target, the real work is choosing which levers to pull. Not all of them cost the same, and not all of them protect quality equally.
Staffing and scheduling come first because they’re the most direct control you have. Intraday staffing adjustments, accurate shrinkage accounting (breaks, training, absenteeism), and a float or backup pool for volume spikes prevent the predictable dips that show up every Monday morning or after a product launch email goes out.

Routing improvements often deliver gains faster than hiring does. Skills-based routing sends calls to the agent best equipped to resolve them quickly. Priority queues protect your highest-value segments from getting stuck behind routine requests, as highlighted in customer loyalty programs: small business guide. Call steering at the IVR level can redirect simple questions before they ever hit a live queue.
Automation and self-service reduce the denominator instead of speeding up the numerator. A well-designed IVR or chatbot that resolves password resets, order status checks, or appointment confirmations removes volume from the queue entirely, which improves service level without adding a single agent hour.
- Deploy self-service deflection for your top 3 to 5 repeat-contact reasons before adding headcount.
- Use skills-based routing to protect high-value or urgent segments from queue congestion.
- Build a float pool sized to your worst recurring volume spike, not your average day.
- Cut average handle time with a current knowledge base, call templates, and a wrap-time cap, without cutting corners on resolution.
- Accept a slower service level on complex technical queues where resolution quality matters more than speed.
Reducing handle time without hurting resolution takes discipline. A current knowledge base cuts search time. Call templates standardize common scenarios so agents aren’t reinventing responses. A wrap-time cap keeps administrative work from ballooning, but only if agents have the tools to close tickets quickly and accurately.
Pro Tip: Before adding agents, audit your top five call reasons. If three of them are answerable through self-service, you may solve your service level problem without touching the staffing budget at all.
Sometimes the right call is to accept a slower service level. A complex technical escalation queue where getting the answer right protects a major account is not the place to optimize for speed. Match the lever to the queue’s actual priority, not a blanket policy.
Reporting Rules That Keep Service Level Honest
A single monthly number tells you almost nothing. Report service level by interval, ideally every 15 to 30 minutes, and pair it with a compliance rate, the percentage of intervals that actually hit target, rather than relying on a rolling average that smooths over bad stretches.

State your inclusion and exclusion rules on every report. Does IVR wait time count against the clock? Are short abandons (under 5 seconds) excluded from the denominator? Verint’s guidance on service level measurement recommends tracking these rules explicitly so leaders comparing numbers across teams or time periods aren’t comparing apples to oranges.
Add distribution charts and percentile breakdowns (50th, 90th, 95th wait times) to your dashboard so the tail becomes visible instead of buried inside an average. A useful reporting setup includes:
- Interval-level service level trend line, updated every 15 to 30 minutes
- Compliance rate showing the share of intervals meeting target
- Wait time distribution with 90th and 95th percentile markers
- Abandonment rate charted alongside service level for the same intervals
- Alert thresholds that flag when service level drops below target for two consecutive intervals
These widgets turn a single lagging number into an early warning system your team can act on the same day, not the following month.
How Altiam CX Applies These Principles in Real Operations
Modeling a service level target is one exercise. Executing it consistently across shifts, holidays, and volume surges is a different discipline entirely, and it’s where most internal teams struggle regardless of how good their math is.
Altiamcx builds service level strategy around three steps: segmenting queues by caller intent and business value, modeling staffing requirements with Erlang-based workforce math, and executing the schedule with the discipline to hold targets when volume gets unpredictable. Our internal Customer Care Workflow 2026 process work applies this same segmentation and modeling discipline to reduce average handle time while protecting resolution quality, rather than treating speed and quality as competing goals.
The queues that struggle most aren’t the ones with too few agents. They’re the ones running one target across every call type, regardless of what that caller actually needs. Segmentation fixes more service level problems than headcount does.
The result of this approach shows up in engagements where clients needed both a faster answer and a stronger resolution rate, not one traded for the other.
What Contact Center Leaders Get Wrong About 80/20
Most operations treat 80/20 as a pass or fail test instead of a starting hypothesis. That’s backwards. The number should be the output of a modeling exercise, not the input you build your staffing plan around.
My honest take: leaders who present 80/20 to finance as an unquestioned standard lose credibility the moment someone asks why. Leaders who present it as a modeled decision, backed by Erlang math and segmented by queue value, get the budget approved and get to keep it during the next cost review.
Before you finalize a target, run this checklist with your finance and executive stakeholders:
- What does each queue’s segment actually need, based on caller patience and revenue exposure?
- What does the marginal agent cost look like for each percentage point of improvement?
- What abandonment rate are we willing to accept, and does it match what we’re modeling?
- Does our target protect FCR and CSAT, or does it just optimize for a faster pickup?
Align the target with what the business actually needs from that queue, not with what looks good on a slide. Customers tolerate different wait times for different problems. Your targets should reflect that instead of pretending every call is equally urgent.
Get Modeling and Execution Support for Your Service Level Strategy
Modeling the right target is only half the job. Holding it through a holiday surge, a product launch spike, or a bad flu season requires staffing discipline that most internal teams don’t have the bandwidth to sustain alongside everything else on their plate.

Altiamcx builds service level strategy the way this guide describes it: segmented by queue, modeled with Erlang-based workforce math, and executed by teams trained to hold targets under real volume pressure, not just in a spreadsheet. One case study shows a software platform that migrated technical support to Altiamcx and improved productivity by 89% while maintaining service quality throughout the transition. If your team is weighing whether to hire, restructure, or bring in a nearshore partner to execute a modeled target, explore Altiamcx’s nearshore customer experience outsourcing and request a conversation about your specific queue mix and volume patterns.
Frequently Asked Questions
What does an 80/20 service level actually mean? It measures speed of access, not whether the call resolved the customer’s issue.
Is 80/20 the right service level for every contact center? Not necessarily. It’s a widely used convention rather than a proven optimal standard. Queues handling urgent or high-value calls may need tighter targets, while routine inquiry lines may perform fine at a looser one.
How do I calculate service level for my own queue? Divide the number of calls answered within your threshold (commonly 20 seconds) by the total number of calls offered in that interval, then multiply by 100. Confirm whether short abandons and IVR time are included in your denominator.
What metrics should I track alongside service level? Average speed of answer, abandonment rate, first contact resolution, and CSAT. These reveal whether a fast answer is coming at the cost of resolution quality.
How often should service level be reported? Report it by interval, ideally every 15 to 30 minutes, alongside a compliance rate showing how many intervals actually hit target. A single daily or monthly average hides intraday volatility.
Sources
- Manager’s Guide to Call Center Service Levels | Verint
- Is 80/20 Still a Reasonable Service Level? | Call Centre Helper