A vendor performance scorecard is a recurring, KPI-based tool that converts raw supplier data into a single, auditable performance score and a governance trigger for action. If you don’t have one running yet, start narrow: pick three to five mission-critical KPIs, assign provisional weights, and schedule your first pilot review for next quarter.
TL;DR:
- A vendor scorecard provides continuous, KPI-based evaluation, tracking supplier performance over time to inform sourcing, renewal, and risk decisions reliably.
- Key metrics should include operational, service, cost, and compliance categories, limited to two or three per category for clarity and accuracy.
- Proper weighting involves scoring KPIs on a scale, applying business-priority weights, and mapping the total to color-coded performance bands for easy decision-making.
- Piloting the scorecard with a small supplier group before scaling helps refine weights and thresholds, reducing rollout risks and increasing stakeholder buy-in.
- Integrating scorecards into the procurement lifecycle enables proactive management, trend-based conversations, and faster renewal decisions based on objective evidence.
Table of Contents
- What Is a Vendor Performance Scorecard, and Why Do Procurement Teams Use It?
- Essential KPIs and Metric Categories to Include
- How Do You Weight and Score a Vendor Scorecard?
- Step-by-Step: Build, Pilot, and Scale a Vendor Scorecard Program
- What Tools and Data Sources Power an Effective Scorecard?
- Where Scorecard Data Belongs in the Procurement Lifecycle
- Common Pitfalls and Best Practices
- Scorecard Templates and Examples Across Industries
- What Impact Do Scorecards Actually Have on Supplier Management?
- How Do You Align Scorecard Metrics With Business Strategy?
- A Practitioner’s View: Applying Scorecards to Outsourced and Nearshore Teams
- Altiam CX: A Performance-Driven Partner for Closing Capability Gaps
- Sources
What Is a Vendor Performance Scorecard, and Why Do Procurement Teams Use It?
A vendor performance scorecard is a structured evaluation framework that measures, tracks, and compares supplier performance over time, feeding directly into sourcing, renewals, and risk management decisions. That distinction matters more than it sounds. A one-off vendor evaluation is a snapshot. A scorecard is a recording, run monthly or quarterly against the same metrics, the same weights, and the same thresholds, so you can see a supplier’s trajectory instead of guessing at it from memory or a single bad delivery.
Procurement teams that skip this step tend to make renewal decisions based on whoever complained loudest last quarter. Scorecards fix that by turning supplier evaluation into a standardized, continuous process across quality, delivery, cost, compliance, and innovation. The business case comes down to three outcomes:
- Visibility. You know which suppliers are drifting before a failure becomes a crisis.
- Accountability. Both sides agree on what “good” looks like, in numbers, not adjectives.
- Evidence. Renewal and sourcing conversations run on data instead of anecdote.
Not every supplier needs the same treatment. Operational scorecards, tracking delivery timing, defect rates, and ticket resolution, suit transactional vendors where the relationship is mostly about consistency. Strategic scorecards go further, layering in innovation contribution, total cost of ownership, and joint improvement planning for the handful of suppliers who actually shape your competitive position. Applying a strategic-tier scorecard to a low-spend commodity supplier wastes everyone’s time. Applying an operational-only scorecard to your largest strategic partner leaves real risk unmeasured.
Essential KPIs and Metric Categories to Include
Every scorecard needs four to five metric categories, and each one answers a different question about the relationship.
Operational metrics answer “does the supplier deliver reliably?” That means on-time delivery rate, defect rate, order accuracy, and lead-time variance. These are the metrics with the most data behind them because they come straight out of your ERP and receiving records, and they’re usually the first ones any new scorecard should track.
Service metrics answer “how fast do they respond when something breaks?” Issue resolution time, general responsiveness, and SLA breach counts belong here.
Cost and value metrics answer “what are we actually getting for the spend?” Price trend versus market, total cost of ownership, documented cost avoidance, and supplier-led innovation all sit in this bucket. Gartner’s guidance on supplier scorecards specifically pushes procurement teams to track value-oriented metrics and innovation contribution alongside pure operational compliance. That’s the category most scorecards under-build, because innovation is harder to quantify than a delivery date.
Compliance and ESG metrics answer “are they a risk to us?” Certifications, safety incident counts, and adherence to your supplier code of conduct all belong here, particularly for regulated industries like healthcare and financial services.
Pro Tip: Limit yourself to two or three metrics per category. A pragmatic rule from Precoro’s scorecard research is that piling on more metrics than that doesn’t improve accuracy, it just buries the signal you actually need under noise nobody reviews.
Nearly 40% of organizations reported rising sourcing costs in 2024, which is exactly why structured scorecards matter now more than in a low-inflation environment. When costs are climbing across the board, you need a mechanism that separates the suppliers holding their pricing and quality steady from the ones quietly passing every increase straight to you.
Before you finalize a metric list, ask one question of each candidate: does the data source already exist, and is it reliable? A KPI you can’t measure cleanly every cycle is worse than no KPI at all, because it erodes trust in the whole scorecard.
How Do You Weight and Score a Vendor Scorecard?
Weighted composite scoring is how you turn five or six different metrics into one number a leadership team can act on without reading a spreadsheet. The standard method: score each KPI on a 1 to 5 scale, multiply by a weight that reflects business priority, then sum the results into a composite score.
A simple example for a mid-tier supplier:
That table produces a composite score of 4.05 out of 5, which then maps to a color band:
- Green (4.0–5.0): Meeting or exceeding expectations. Standard cadence continues.
- Yellow (3.0–3.9): Watch list. Trigger a conversation and a corrective plan.
- Red (below 3.0): Formal remediation, and possibly a sourcing review.
Weighting is where scorecards go wrong most often, because a template built for a strategic supplier doesn’t fit a transactional one. Weight delivery and cost heavier for commodity vendors; weight innovation and compliance heavier for strategic partners whose failures carry bigger downstream risk.
Pro Tip: Build a validation rule into the scorecard itself: if a data field is missing for a given cycle, flag the composite score as “provisional” rather than letting a zero or a blank silently drag the average down. Missing data is a data problem, not automatically a performance problem.
Step-by-Step: Build, Pilot, and Scale a Vendor Scorecard Program
Rolling out a scorecard program across every supplier on day one is how most initiatives collapse under their own weight. A five-step sequence keeps the effort proportional to the payoff.
- Define objectives and tier your suppliers. Decide what you’re actually trying to fix, cost overruns, delivery inconsistency, quality drift, before you pick a single metric. Segment suppliers into strategic, preferred, and transactional tiers, because the scorecard depth should scale with the relationship’s importance.
- Choose KPIs and map them to data sources. For each metric, name the exact system it comes from: ERP for delivery and pricing data, your quality management system for defect rates, your helpdesk or ticketing platform for response times. If a KPI has no clean source, either fix the data pipeline or drop the metric for now.
- Build the template, the calculation logic, and preliminary weights. This is where you draft the actual scoring sheet, whether that’s a shared spreadsheet or a dashboard view, and set weights based on the objectives from step one. Treat these weights as a hypothesis, not a final answer.
- Pilot with a small supplier set. Amazon Business’s build framework recommends running the pilot with a handful of suppliers, holding a quarterly business review against the scores, and gathering feedback from both your internal stakeholders and the suppliers themselves. A pilot surfaces weighting problems you’d never catch on paper, like a “responsiveness” metric that unfairly penalizes a supplier in a distant time zone.
- Refine and scale. Adjust weights and thresholds based on what the pilot revealed, then extend the scorecard to the rest of the supplier base tier by tier. Embed the outputs directly into sourcing evaluations and contract renewal checklists so the scorecard isn’t a side project that lives outside your actual procurement workflow.
Running the pilot before scaling isn’t just caution for its own sake. A pilot-first approach reduces rollout friction because you’re adjusting weights against real data instead of theoretical assumptions, and suppliers are more receptive to a scorecard they helped shape during a trial run than one dropped on them fully formed.
What Tools and Data Sources Power an Effective Scorecard?
A scorecard is only as good as the data feeding it, and manual data pulls are where most programs die a slow death after quarter two. The core sources worth automating first are your ERP for delivery and cost data, your purchase order and goods receipt records for accuracy checks, your quality management system for defect tracking, and your helpdesk or ticketing platform for responsiveness metrics.
A functional vendor management dashboard needs a handful of specific views, not a wall of charts:
- Filters by supplier tier, category, and business unit, since a single flat view hides more than it reveals
Automation’s real payoff isn’t aesthetics, it’s catching problems early. Shared supplier dashboards and analytics portals let both sides see the same numbers in near real time, which cuts the lag between a metric slipping and a corrective conversation starting. That shared visibility also tends to reduce the defensiveness that creeps into supplier reviews when one side shows up with data the other side has never seen.
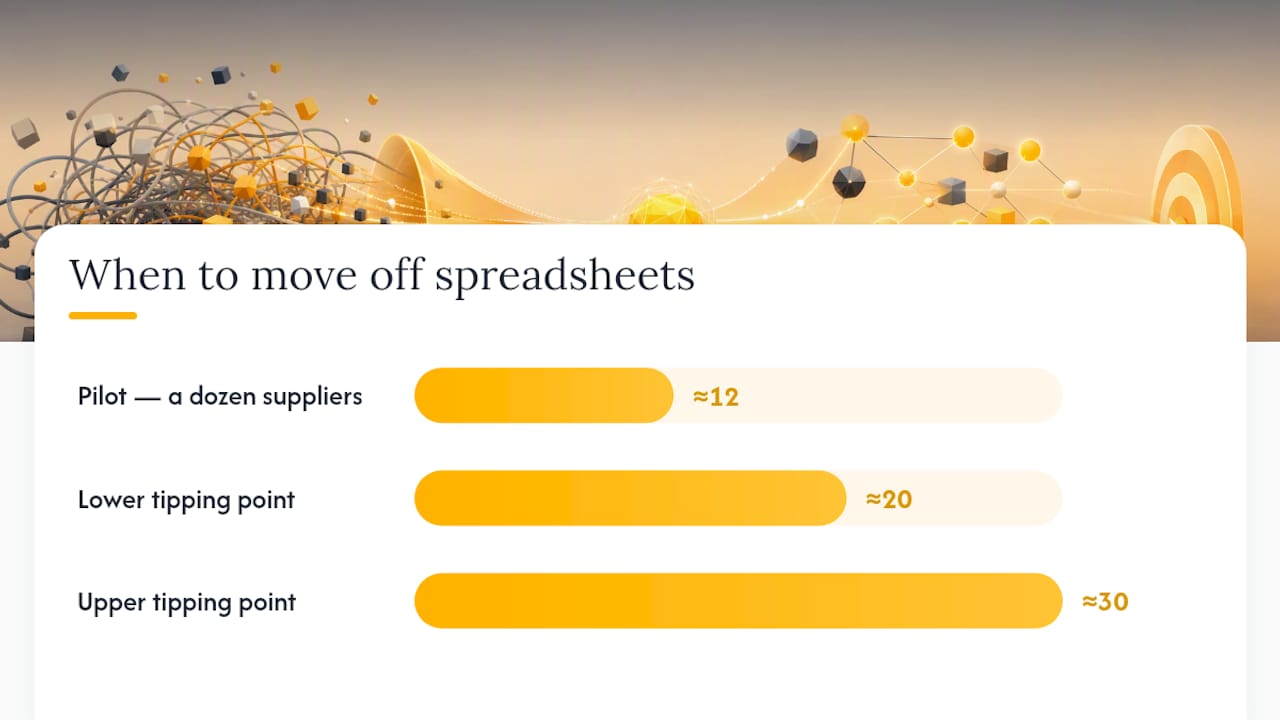
Spreadsheets are fine for a pilot covering a dozen suppliers. Once you’re tracking more than roughly 20 to 30 suppliers, or need automated alerts and audit trails for compliance-heavy industries like healthcare or financial services, a purpose-built procurement platform earns its cost. The tipping point isn’t the number of suppliers so much as how many people need trustworthy, real-time access to the same score without emailing a spreadsheet back and forth.
Where Scorecard Data Belongs in the Procurement Lifecycle
A scorecard that only lives in a quarterly meeting is underused. The real value shows up when its output feeds decisions across the entire supplier relationship:
- Onboarding: baseline expectations and initial risk checks for new suppliers.
- Sourcing and bid evaluation: past performance scores weighted into new RFP decisions.
- Contract renewals: scorecard history as documented evidence for renegotiation or termination.
- Corrective action workflows (CAPA): a red-band score automatically triggering a formal improvement plan.
Cadence should scale with supplier tier: monthly reviews for strategic suppliers, quarterly for preferred suppliers, and event-driven reviews (triggered by a missed delivery or a quality escape) for transactional ones. When you share results, frame the conversation around the trend line, not a single bad quarter, and always pair a red or yellow score with a specific, time-bound corrective action rather than a vague “please improve.” Our guide to reviewing scorecard results collaboratively walks through structuring that conversation so it reads as partnership, not a report card.
Common Pitfalls and Best Practices
Scorecards fail in predictable ways. The most common: over-weighting easy-to-measure administrative metrics (paperwork submitted on time) while under-weighting the metrics that actually affect the business (defect rate, cost creep). A close second is scorecard sprawl, adding a new metric every time something goes wrong until the scorecard has 20 KPIs nobody reviews consistently. Inconsistent thresholds across supplier categories create a third problem: two suppliers with identical real performance land in different color bands simply because someone set the bands differently.
- Standardize one core template, then customize weights by tier rather than building a new template per supplier.
- Iterate the weighting after the pilot instead of treating the first version as final.
- Communicate thresholds to suppliers before the first review, not after a red score surprises them.
- Use the scorecard for supplier development, not as ammunition in a punitive conversation.
Pro Tip: Before rollout, run a short checklist: confirm each data source is reliable, get sign-off from the stakeholders who’ll act on red scores, and write a one-page pilot plan naming which suppliers, which metrics, and which review date come first.
Scorecard Templates and Examples Across Industries
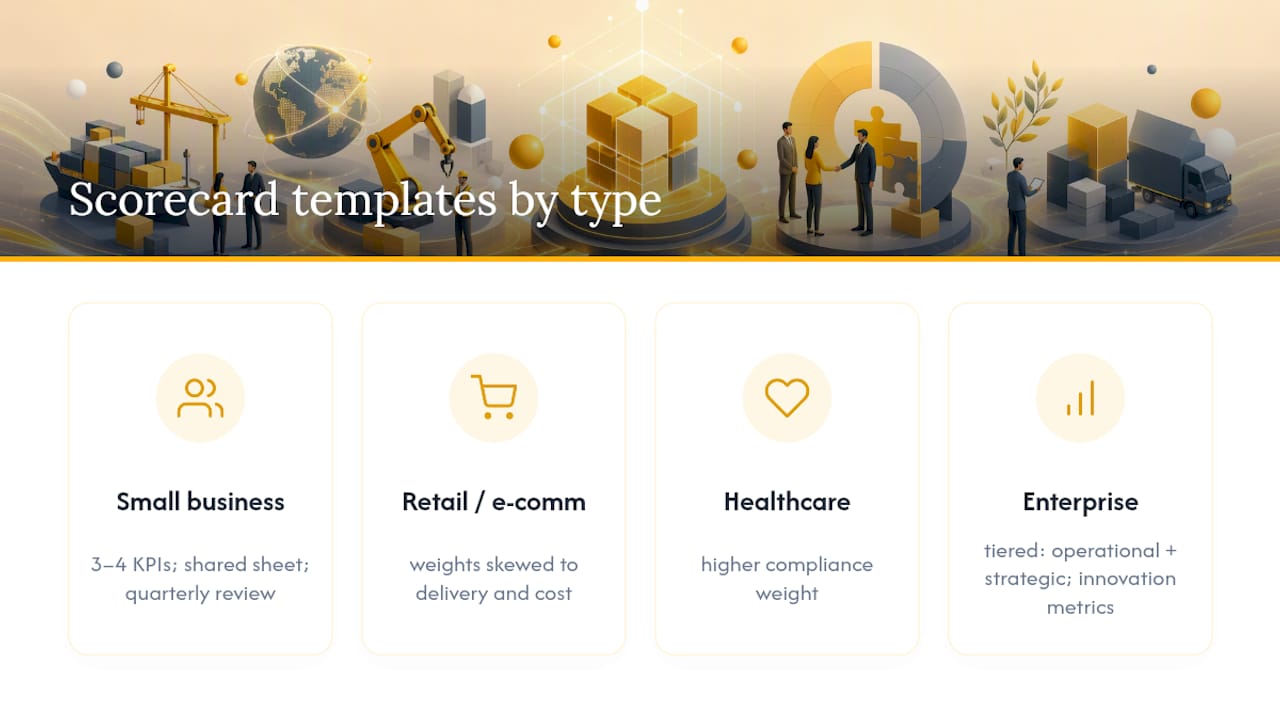
A healthcare procurement team’s scorecard looks different from a retailer’s, mostly because the compliance weight shifts dramatically. A retail or ecommerce operation, by contrast, usually weights delivery and cost more heavily, since stockouts and margin erosion hit revenue directly and fast.
Smaller businesses tend to run lighter templates: three or four KPIs, tracked in a shared spreadsheet, reviewed quarterly with the two or three suppliers that actually matter to the business. There’s nothing wrong with that scale. A ten-supplier company forcing itself into an enterprise-grade dashboard is solving a problem it doesn’t have yet.
Enterprise procurement teams, especially in financial services and legal, tend to run tiered templates: a lightweight operational scorecard for transactional vendors and a much deeper strategic scorecard, complete with innovation metrics and joint business planning sections, for the small group of suppliers whose failure would actually disrupt the business. Precoro’s downloadable scorecard templates offer a reasonable starting structure for teams building their first version, particularly the IT-focused format for organizations managing technology vendors alongside physical goods suppliers.
The common thread across every industry version: the categories stay roughly the same (quality, delivery, cost, compliance, responsiveness), but the weights shift to match what actually breaks the business if it goes wrong.
What Impact Do Scorecards Actually Have on Supplier Management?
Organizations that move from ad hoc vendor reviews to a standardized scorecard consistently report the same shift: the conversation with suppliers changes from reactive to proactive. Instead of a call after a missed shipment, the account team sees a KPI trending yellow two cycles before it would have become a real problem.
Documented examples from Precoro’s scorecard research point to measurable gains in on-time delivery rates specifically tied to the introduction of a formal scorecard, largely because suppliers respond to metrics they know are being tracked and shared back to them regularly. That’s not a mysterious effect. A supplier who sees their own delivery variance charted every month behaves differently than one who only hears about problems in an angry email.
The bigger shift is qualitative. Once a scorecard is in place, quarterly business reviews stop being status updates and start being planning sessions, because both sides are looking at the same trend line instead of arguing over whose recollection of last month is correct. Renewal decisions get faster too, since the evidence already exists instead of needing to be assembled under deadline pressure when a contract is about to expire. None of this requires a massive platform investment to start. It requires consistent measurement against the same KPIs, cycle after cycle, long enough for a real pattern to show up.
How Do You Align Scorecard Metrics With Business Strategy?
A scorecard disconnected from your actual business goals just measures activity, not impact. If the priority is market expansion into a new region, supplier flexibility and lead-time variance in that specific geography deserve more weight than your standard template gives them.
The practical move is to revisit weights annually against whatever the business’s top three priorities are for that period, rather than letting the original weighting scheme run unexamined for years. A supplier tier matters here too: your strategic suppliers’ scorecards should mirror the metrics your executive team actually reports upward, cost avoidance, innovation contribution, risk exposure, so the scorecard output can be lifted directly into a business review instead of translated first.
This is also where the category-specific service quality metrics that matter to your operations, response time, resolution accuracy, escalation rates, need to show up explicitly rather than getting absorbed into a generic “service” score. Vague categories hide exactly the detail a strategy conversation needs.
A Practitioner’s View: Applying Scorecards to Outsourced and Nearshore Teams
The same KPI framework that governs a physical goods supplier works just as well for a managed nearshore team, and honestly, it should. Delivery becomes ticket resolution time. Quality becomes accuracy or first-contact resolution. Compliance becomes adherence to your data-handling and security standards. The categories don’t change; only the data source does.
Where a managed partner adds real value is closing the data gaps that make scorecards unreliable in the first place. A partner running disciplined SLA reporting and shared dashboards removes the guesswork from responsiveness metrics, because the ticketing data is already structured and shared, not reconstructed from memory before a quarterly review.
My advice for teams extending a scorecard to outsourced services: start with operational metrics, response time, resolution rate, SLA adherence, before layering in value metrics like cost avoidance or process improvement. Get the basics measuring cleanly first. Everything else is easier to add once the foundation actually holds.
— Daniela
Altiam CX: A Performance-Driven Partner for Closing Capability Gaps
If your scorecard just flagged a capability gap, staffing up internally isn’t the only route to close it. Altiamcx applies the same disciplined, KPI-based performance frameworks this article just walked through, response time, resolution accuracy, SLA adherence, to nearshore customer care, technical support, and back-office teams built for healthcare, legal, ecommerce, and financial services organizations.

That means the managed team extension is structured to align with the metric categories your scorecard tracks, with cultural alignment and disciplined execution built into how the team runs day to day. One software platform migrated its tech support to Altiam CX and improved productivity by 89%, a concrete example of what a governed, metrics-driven nearshore engagement can move on a scorecard. Another organization used a nearshore team extension model to scale support capacity while keeping performance visibility intact.
If a scorecard review just surfaced a gap in responsiveness or support capacity your internal team can’t close fast enough, visit the Altiamcx team extension page to see how a managed nearshore engagement gets structured around the same KPIs you’re already tracking.
Sources
For teams building their first scorecard, five resources are worth keeping open in a browser tab. Ivalua’s scorecard guide covers the definition and KPI categories in depth. Amazon Business’s build framework lays out the step-by-step deployment sequence this article follows. Gartner’s supplier scorecard research pushes the case for value and innovation metrics. Precoro’s template library offers downloadable starting formats. Zycus’s glossary entry gives a clean baseline definition tying scorecards to sourcing and risk management.
- Vendor Scorecards: Complete Guide For Procurement Teams
- Gartner’s Supplier Scorecard improves supplier performance
- Vendor Scorecard: Definition, Benefits, and Examples
- What is Vendor Performance Scorecard? - Zycus