
Call center shrinkage is the percentage of paid, scheduled agent time lost to anything other than handling contacts, from breaks and training to sick days and system outages. If your shrinkage rate is 30%, you need roughly 43% more scheduled hours than your raw workload requires. Get the formula wrong, and every staffing plan built on top of it fails before the shift even starts.
TL;DR:
- A 30% shrinkage rate requires scheduling approximately 43% more hours than the raw workload to ensure adequate coverage.
- Shrinkage should be segmented by category and channel to accurately identify where staffing adjustments are needed.
- Miscalculating by plugging in scheduled hours instead of the available hours after shrinkage leads to under-scheduling staff by 10 to 15 percentage points.
- Reducing shrinkage effectively involves improving forecast accuracy, optimizing workflows, and controlling unplanned absences through better policies.
- Tracking shrinkage over at least four to six weeks provides a more reliable basis for staffing decisions than short-term or isolated measurements.
Table of Contents
- What Is Call Center Shrinkage and How Do You Calculate It?
- What Causes Shrinkage in a Call Center?
- How Do You Avoid the Shrinkage Trap When Calculating Staffing?
- What Is a Good Shrinkage Rate for a Call Center?
- How Can You Reduce Shrinkage in a Call Center?
- Is Shrinkage the Same as Agent Utilization?
- What Does Reducing Shrinkage Actually Look Like in Practice?
- Where Should Operations Leaders Start?
- A Practical Route to Lower Shrinkage: Managed Team Extension
- Sources
- FAQ
What Is Call Center Shrinkage and How Do You Calculate It?
Shrinkage measures the gap between the hours you pay for and the hours agents actually spend on contacts. Genesys defines it as the portion of paid scheduled time agents are unavailable because of breaks, training, meetings, or unplanned absences. Workforce management (WFM) teams treat it as a planning input, not just a reporting metric.
The formula is simple:
Shrinkage (%) = (Total time not available ÷ Total scheduled hours) × 100
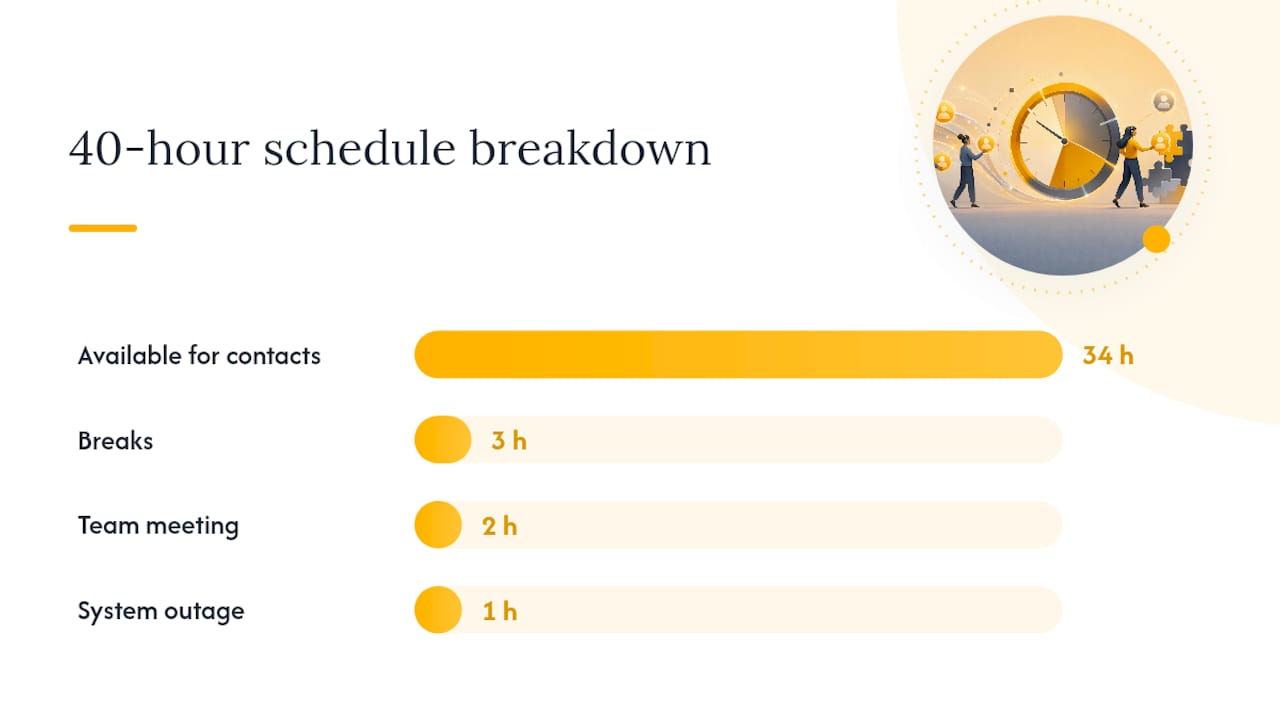
Here’s a worked example. Say an agent is scheduled for 40 hours a week. Across that week, she takes 3 hours of breaks, spends 2 hours in a team meeting, and misses 1 hour to a system outage. That’s 6 hours unavailable out of 40 scheduled.
- Divide 6 by 40, which equals 0.15.
- Multiply by 100 to get a shrinkage rate of 15%.
- Apply the staffing equation: scheduled hours = required hours ÷ (1 − shrinkage rate).
- If you need 100 hours of actual talk time covered, you schedule 100 ÷ 0.85, or roughly 118 hours.
That gap between 100 and 118 hours is the cost of shrinkage. Ignore it, and your schedule looks fully staffed on paper while your floor runs short every single shift.
What Causes Shrinkage in a Call Center?
Shrinkage splits into two buckets: the hours you plan for and the hours that ambush you. Both count against the same denominator, but they demand different fixes.
Planned (internal) shrinkage includes activities baked into the schedule:
- Breaks and lunches
- Team meetings and one-on-ones
- Required training and coaching sessions
- Administrative work, like updating CRM records
- Scheduled system maintenance
Unplanned (external) shrinkage is the harder category to forecast:
- Unscheduled absences and call-outs
- Sick leave and personal emergencies
- Extended personal time off approved late
- Technology failures or outages outside the team’s control
- Weather events or facility disruptions
Smart WFM teams don’t stop at a single blended number. They segment shrinkage by cohort (new hires versus tenured agents), by channel (voice typically shrinks more than chat), and by time of day, since Monday-morning absenteeism rarely matches Friday-afternoon patterns. Seasonal spikes matter too. Open enrollment periods in healthcare support, tax season in financial services, and holiday retail surges all push unplanned shrinkage well above baseline. If you only track one shrinkage number for the whole center, you’ll miss exactly where it’s coming from.
How Do You Avoid the Shrinkage Trap When Calculating Staffing?
The math itself is straightforward. The mistake most teams make is which numbers they plug into it.
- Calculate single-agent shrinkage using the hours-lost-over-hours-scheduled formula above.
- Aggregate to the team or period level by summing all unavailable hours across agents, then dividing by total scheduled hours for that same group and window.
- Convert to gross scheduled hours using required hours ÷ (1 − shrinkage rate), never the reverse.
Here’s a team-level example. A 20-agent team is scheduled for a certain number of hours in a week. Logged unavailable time totals a substantial share of scheduled hours, resulting in a significant shrinkage rate.
The shrinkage trap: teams often divide required hours by the scheduled percentage instead of by
(1 − shrinkage rate). Call Centre Helper’s analysis flags this as a common error that systematically under-schedules staff, sometimes by 10 to 15 percentage points of coverage, without anyone noticing until service levels collapse.
Pull your shrinkage inputs directly from your WFM platform’s adherence logs rather than manager estimates, and calculate over a rolling window of at least four to six weeks. A single unusual week, like one with a system outage or a holiday, will distort a shorter sample and send you chasing a number that isn’t representative.
What Is a Good Shrinkage Rate for a Call Center?
Planned shrinkage covers everything you schedule on purpose. Unplanned shrinkage covers everything you don’t. Both eat into available hours, but only one is predictable enough to build directly into your base schedule. The other needs a buffer.
Realistic benchmarks vary more than most managers expect:
- Blended industry ranges commonly cited fall between 30% and 35% of total scheduled time.
- Voice-heavy centers tend to sit at the higher end, often 32% to 35%, because phone support carries more meeting and training overhead.
- Chat-focused or digital-first operations often run lower, since agents can multi-thread conversations during lighter unavailable periods.
- Healthcare, legal, and other compliance-heavy environments frequently exceed the blended range, driven by mandatory certification training and documentation requirements.
If your actual shrinkage consistently runs 5 or more points above your target, that’s the trigger to investigate root cause, not just pad the schedule further. Setting a target without segmenting by channel and obligation type is how centers end up chronically over or understaffed. NICE’s shrinkage guidance makes the same point: track by category, because a blended average hides where the real pressure sits.
How Can You Reduce Shrinkage in a Call Center?
Reducing shrinkage isn’t one initiative. It’s a stack of smaller decisions across forecasting, scheduling, real-time management, training design, and people policy that compound over a quarter.
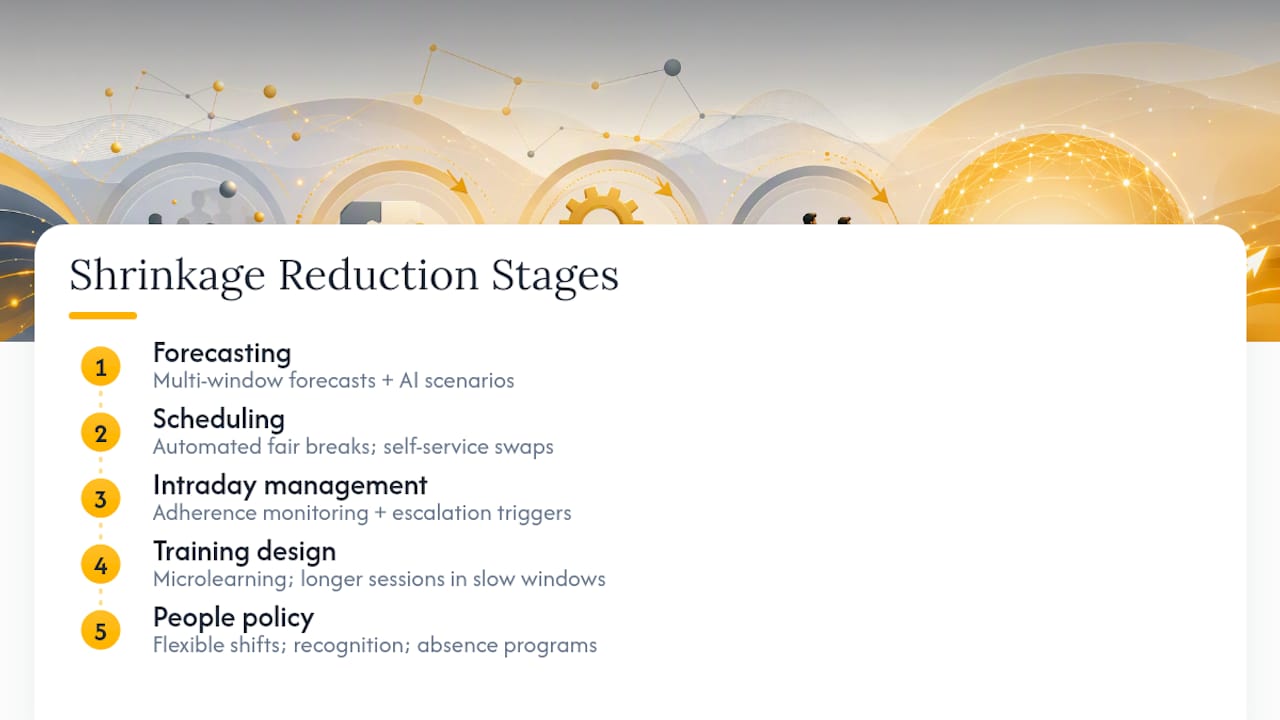
Forecasting comes first. Shrinkage math is only as good as the demand forecast underneath it. Centers that pull multiple historical windows and layer in AI-assisted models catch seasonal and event-driven spikes that flat averages miss. Microsoft’s workforce management guidance points to scenario planning as a direct lever on both forecast accuracy and the resulting shrinkage buffer you need to carry. Tighter forecasts mean fewer emergency schedule patches, which is itself a shrinkage reduction.
Scheduling needs to distribute fairly and flex easily. Automated scheduling tools that spread breaks evenly across the day, rather than clustering them at shift change, prevent coverage gaps during peak intervals. Giving agents self-service options for shift swaps and PTO requests cuts down on last-minute call-outs that show up as unplanned shrinkage.
Intraday management catches what forecasting misses. Real-time adherence monitoring, paired with clear escalation triggers, lets supervisors reallocate staff or offer voluntary overtime the moment adherence drifts from plan. Salesforce’s contact center guidance treats this rapid response capability as essential to protecting service levels when shrinkage deviates intraday, not just weekly.
Training and admin work belong in low-demand windows. Shifting formal training into microlearning modules, and scheduling longer sessions during historically slow periods, preserves agent availability without cutting the training itself.
Automation absorbs volume before it becomes a staffing problem. Chatbots and automated triage for routine inquiries reduce the contact volume that agents need to cover, which lowers the required-hours side of the staffing equation and eases pressure on shrinkage buffers.
People levers matter as much as technology. Flexible shift patterns, recognition programs, and targeted absence-management initiatives address the root causes of unplanned shrinkage rather than just scheduling around it.
Track progress with a small set of KPIs: forecast accuracy, schedule adherence, occupancy, and shrinkage broken out by category. If one number moves without the others, you’re solving the wrong problem.
Pro Tip: Review shrinkage by category monthly, not just the blended total. A rising “meetings and training” line often means someone added a recurring calendar invite that never got reviewed against its cost in coverage.
Is Shrinkage the Same as Agent Utilization?
No, and mixing them up leads to bad staffing decisions. Shrinkage measures the percentage of scheduled time an agent is unavailable. Utilization measures how much of an agent’s available time is spent actively working, whether on live contacts or after-call work.
- Shrinkage = hours lost ÷ total scheduled hours.
- Utilization = productive hours ÷ available (non-shrunk) hours.
- A center can post low shrinkage while utilization still lags, if agents are logged in and adherent but sitting idle between contacts due to poor call routing.
- Conversely, high utilization with rising shrinkage often signals burnout risk, since agents are being pushed hard during the hours they are available.
Shrinkage responds to scheduling, forecasting, and absence management. Utilization responds to routing logic, staffing precision, and workload balancing. Optimize both, but don’t expect one to fix the other.
What Does Reducing Shrinkage Actually Look Like in Practice?
Forecasting accuracy is the lever that moves everything else. Centers running AI-assisted forecasting models close to the ±5% accuracy range build schedules with far less intraday scrambling, because the base plan already reflects realistic demand instead of a rough average.
That accuracy compounds with workflow design. Restructuring handling procedures and consolidating redundant steps can cut average handling time by roughly 30%, which reduces the required-hours side of the staffing equation and eases the pressure that shrinkage buffers have to absorb. Fewer required hours per contact means less exposure when unplanned absences hit.
The combination, tighter forecasts plus leaner handling workflows, doesn’t eliminate shrinkage. It shrinks the buffer you need to carry against it, which is the outcome operations leaders actually care about.
Where Should Operations Leaders Start?
Measure accurately before you touch anything else. Most shrinkage problems are diagnosed wrong because the underlying number was never trustworthy to begin with. Once measurement is solid, fix forecasting, then automate scheduling and intraday response, then tackle people policy. Push too hard on productivity gains without watching agent experience, and you’ll trade a shrinkage problem for an attrition problem, which costs more to fix.
— Daniela
A Practical Route to Lower Shrinkage: Managed Team Extension
Fixing shrinkage internally takes months of forecasting rework, scheduling overhauls, and change management most operations teams don’t have spare capacity for. Altiamcx offers a different path: nearshore managed team extension that brings disciplined workforce practices in from day one, instead of asking your existing team to rebuild them from scratch.

Altiamcx’s Managed Customer Support model pairs bilingual agents with structured forecasting and adherence monitoring, so coverage gaps get caught before they hit service levels. This structure matters even more for compliance-heavy operations like healthcare, where training obligations push shrinkage above blended benchmarks. The approach emphasizes cultural alignment and disciplined execution from nearshore locations, aimed at better ROI and more stable staffing than juggling reduction tactics alone.
If chronic understaffing or unpredictable coverage gaps are costing you service levels, consider exploring what a managed team extension model could look like for your center.
Sources
- What is Call Centre Shrinkage and How to Calculate It? | Call Centre Helper
- What is call center shrinkage and how can you reduce it? | Zoom
- Workforce management overview | Microsoft Dynamics 365
- What Is Shrinkage in Workforce Management? | NICE
FAQ
What Is the Average Shrinkage Rate for a Call Center?
Blended industry ranges commonly fall between 30% and 35% of scheduled time, with voice-heavy centers trending toward the higher end and digital-first channels often running lower.
What Does Shrinkage Mean in a Call Center?
Shrinkage is the percentage of paid, scheduled agent time lost to breaks, training, meetings, absences, or system issues, as opposed to time spent actively handling contacts, per Genesys’s definition.
How Do You Calculate Staff Shrinkage in a Call Center?
Divide total unavailable hours by total scheduled hours and multiply by 100 to get the percentage; then use scheduled hours = required hours ÷ (1 − shrinkage rate) to set your actual staffing plan.