
Operational visibility is the ability to see, correlate, and act on signals across your systems, people, and customer touchpoints in real time, and it directly determines how well your organization delivers on its CX promises. When that visibility is strong, teams detect incidents faster, reduce customer-impact minutes, and make decisions with confidence rather than guesswork. When it’s weak, customers feel the gap before your dashboards do.
The immediate business case comes down to three outcomes that operations leaders care about most:
- Faster decisions: Real-time operational visibility replaces monthly reporting cycles with continuous intelligence, cutting the time from signal to action.
- Cost avoidance: Shorter mean time to resolution (MTTR) and fewer repeat incidents reduce the operational cost of service failures.
- Higher customer satisfaction: Proactive issue identification prevents the customer-facing degradation that drives CSAT and NPS scores down.
Key Takeaways
Operational visibility is the single most direct lever operations managers have for improving CX outcomes and accelerating real-time decisions across the service chain.
| Point | Details |
|---|---|
| Start with critical journeys | Map dependencies and instrumentation gaps for your top two or three journeys before buying any new platform. |
| Data distance is the real problem | Most teams already have the data they need; the investment is in integration, not new tool procurement. |
| MTTR and customer-impact minutes are your north-star KPIs | These two metrics link operational performance directly to CX outcomes and drive the right response behaviors. |
| Pilot in 4 weeks, then scale | A narrow pilot covering two journeys produces faster ROI than a comprehensive program that takes six months to launch. |
| Altiamcx as a managed option | Altiamcx delivers nearshore teams with built-in runbooks, dashboards, and SLA frameworks, compressing the path from visibility gap to working capability. |
Table of Contents
- What does operational visibility actually mean in CX operations?
- Why operational visibility matters for customer experience and real-time decisions
- What are the core components that enable operational visibility?
- How do you build operational visibility for CX in seven steps?
- Which KPIs should you monitor for CX reliability and operational health?
- Why does end-to-end CX observability require service dependency mapping?
- What challenges and costs should you plan for?
- How does a CX operations partner operationalize visibility?
- The visibility work that actually moves the needle
- Altiamcx delivers operational visibility as a managed capability
- Sources
What does operational visibility actually mean in CX operations?
Operational visibility, sometimes called operational observability in engineering contexts, means having a connected, real-time picture of every system, process, and person that touches a customer interaction. It goes beyond a single platform’s built-in reporting. The scope includes data sources such as agent desktop telemetry, CCaaS (cloud contact center as a service) metrics, CRM event streams, network and audio quality signals, third-party API health, and device-level data. It also includes the dashboards, alert rules, and governance structures that turn raw signals into decisions.
A visibility gap looks like this: a customer calls in, experiences choppy audio, and hangs up frustrated. Your CCaaS dashboard shows the call connected and lasted 90 seconds. Nothing flags as an incident. The agent marks it resolved. Cloud contact center platforms commonly miss last-mile, device, and network signals that determine what the customer actually experienced, so the failure stays invisible until it shows up in a CSAT survey three days later.
Operational visibility supports coordination, performance monitoring, and faster response to operational issues across the full service chain, not just the platforms your team manages directly.
Why operational visibility matters for customer experience and real-time decisions
The core cause-effect relationship is direct: when you can see what’s happening across your operations in real time, you detect incidents earlier, route ownership faster, and prevent the same failure from recurring. Each of those outcomes reduces the minutes a customer spends in a degraded experience.
Industry research consistently shows that organizations shifting from periodic reporting to event-driven, real-time analytics gain measurable decision advantage, including faster MTTR and clearer accountability across teams. The shift from monthly reporting to continuous intelligence is what Gartner and industry analysts describe as the move to real-time operational visibility.
Visibility also shortens the feedback loop for decisions. When a supervisor can see agent handle time, queue depth, SLA compliance, and network quality on one screen, they don’t need to wait for an end-of-day report to act. That speed matters most during incidents, when every minute of delay translates directly into customer-impact minutes.
The CX business impacts that follow from strong visibility include:
- NPS and CSAT uplift from fewer undetected degradations reaching customers.
- MTTR reduction because ownership is clear and runbooks are triggered automatically.
- Fewer escalations because front-line teams catch issues before customers escalate them.
- Improved SLA compliance because threshold alerts fire before breaches occur.
Operational visibility also enables proactive issue identification by instrumenting real-world product behavior and user journeys, which is the same principle applied to CX operations. And it’s the prerequisite for trustworthy AI: AI needs coherent, connected operational data to detect trends and anomalies accurately. Feed it disconnected signals and you get unreliable alerts.
What are the core components that enable operational visibility?
Building reliable visibility for CX requires assembling both technical and organizational building blocks. No single platform delivers it out of the box.
Data sources to instrument:
- Agent desktop signals (application performance, login state, handle time)
- CCaaS metrics (queue depth, abandonment rate, transfer rate, wrap time)
- CRM event streams (case creation, escalation triggers, resolution timestamps)
- Network and audio telemetry (packet loss, jitter, MOS scores)
- Third-party API health (payment processors, identity verification, logistics feeds)
- Device-level signals (endpoint performance, headset quality, connectivity)
Platform capabilities you need:
- Event-driven streaming so signals arrive in near real time, not batched
- A correlation and context store that links signals across domains into a single incident view
- Role-specific dashboards and alert thresholds (what a supervisor needs differs from what a network engineer needs)
- Incident workflow triggers and runbook automation
Organizational enablers are where most programs stall. Data governance, clear ownership mapping (who is accountable for each signal source), and an integration-first tooling philosophy are non-negotiable. Many organizations already have the data they need but lack the integration or context to act on it quickly. The problem is data distance from decision, not a shortage of data. Buying more dashboards before closing that distance only adds noise.
For a broader view of how operational services fit together for CX leaders, the components above map directly to the live dashboards and automated alerts that enable rapid issue resolution.
How do you build operational visibility for CX in seven steps?
This sequence moves a team from idea to working visibility capability without over-engineering the first iteration.
- Prioritize your critical journeys. Choose two or three customer journeys that carry the highest volume or revenue risk. Start there, not with the full service catalog.
- Map service dependencies. For each journey, enumerate every system, team, and third-party touchpoint involved. Identify who owns each one.
- Choose your integration approach. Decide between a centralized observability platform (faster to deploy, higher licensing cost) and a federated integration layer (more flexible, higher build effort). Match the choice to your existing stack.
- Centralize your data streams. Connect your CCaaS, CRM, network telemetry, and agent desktop signals into a single event bus or data layer. This is the step where ERP and back-office automation integrations become relevant if fulfillment or case management data is part of the journey.
- Build role-specific views. A supervisor dashboard, a network ops view, and an executive summary are three different products. Build them separately against the same data layer.
- Set alerting thresholds and runbooks. Define what a threshold breach looks like for each KPI, who gets notified, and what the first three steps of the response are. Runbooks reduce MTTR more than any dashboard feature.
- Iterate with metrics. After four to eight weeks, review which alerts fired, which were false positives, and which incidents went undetected. Adjust thresholds and add instrumentation where gaps remain.
Which teams to involve: CX operations, IT/network, CCaaS platform owners, CRM administrators, and at least one data or analytics engineer. Governance decisions require a sponsor at the VP or director level.
Pro Tip: Don’t buy a new observability platform before you’ve mapped your data distance. Most teams discover in step 4 that 70–80% of the signals they need already exist in tools they own. The integration work is the investment, not the license.
Which KPIs should you monitor for CX reliability and operational health?
A compact, well-chosen KPI set outperforms a sprawling one. The goal is metrics that link directly to CX outcomes and trigger clear responses when they move.
Recommended KPI set:
- Customer-impact minutes: Total minutes of degraded experience across all active incidents. The single most CX-relevant operational metric.
- MTTR (mean time to resolution): From incident detection to confirmed resolution. Tracks response efficiency.
- Resolved deflection rate: Percentage of issues resolved before customer contact. Measures proactive effectiveness.
- Fulfillment/throughput: Volume of cases, orders, or requests completed per period against target. Tracks operational capacity.
- SLA compliance rate: Percentage of interactions or cases meeting defined service level agreements.
- Agent-level metrics: Handle time, first-contact resolution, and transfer rate. Reveal process and tooling friction.
- Journey-level metrics: End-to-end completion rate and drop-off points for critical customer journeys.
| KPI | Definition | Recommended Cadence | CX Outcome Link |
|---|---|---|---|
| Customer-impact minutes | Total minutes customers experienced degraded service | Real-time + daily | CSAT, NPS |
| MTTR | Mean time from detection to resolution | Per incident + weekly trend | Repeat contacts, escalations |
| SLA compliance rate | % of interactions meeting SLA thresholds | Daily + monthly trend | Customer retention |
| Resolved deflection rate | % of issues caught before customer contact | Weekly | Contact volume, cost per contact |
| Agent first-contact resolution | % of cases resolved on first interaction | Daily | CSAT, handle time |
Operational visibility creates governance capability: when processes are visible, SLA compliance and accountability are easier to enforce consistently. The KPIs above only work if ownership is assigned and thresholds are agreed upon before an incident occurs.
Why does end-to-end CX observability require service dependency mapping?
Most CX failures don’t originate inside the platforms your team monitors. CX incidents concentrate at handoffs and shared responsibilities that platform dashboards alone don’t show. A payment API timeout, a CRM sync delay, or a network hop between your CCaaS and your agent’s ISP can each degrade the customer experience without triggering a single alert in your contact center platform.
Service dependency mapping closes that gap. The practical approach:
- Pick your top two or three revenue-critical or volume-critical journeys.
- Enumerate every touchpoint: systems, APIs, network paths, agent endpoints, and third-party services.
- Assign an owner to each touchpoint.
- Instrument the gaps where you have no signal today.
- Correlate signals into a cause-and-effect view so that when a symptom appears, the upstream cause is visible within seconds.
Pro Tip: Keep your dependency maps manageable by limiting the first version to journeys that account for your top 20% of contact volume or revenue. A map that covers everything is a map nobody maintains.
Continuous observability across app, network, and experience signals is what separates teams that catch problems before customers do from teams that learn about failures from complaint spikes.
What challenges and costs should you plan for?
Setting realistic expectations on effort and investment prevents programs from stalling after the pilot phase.
Common obstacles:
- Legacy system integration: Older CRM, telephony, or ERP systems often lack native APIs or emit signals in formats that require transformation before they’re usable.
- Data quality and governance: Inconsistent timestamps, duplicate records, and undefined ownership make correlation unreliable. Fixing data quality is slower than most teams expect.
- Cultural resistance: Visibility surfaces accountability. Some teams resist instrumentation because it makes performance gaps visible to leadership.
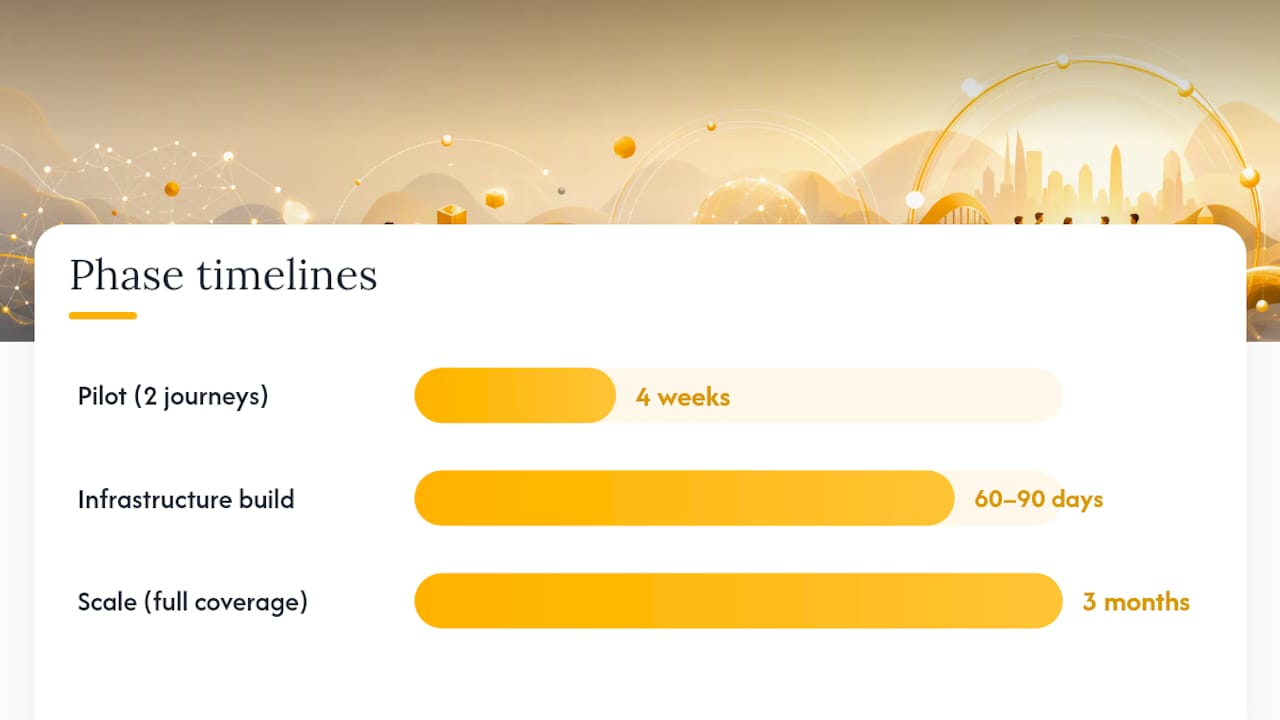
- Upfront investment vs. long-term ROI: The first 60–90 days produce infrastructure, not dashboards. Leaders need to hold the investment through the build phase.
Trade-offs to make explicitly:
- Speed vs. completeness: A fast pilot covering two journeys beats a six-month program covering everything. Start narrow.
- Centralized platform vs. federated integration: Centralized platforms (single-vendor observability suites) deploy faster but create vendor dependency. Federated integration takes longer but fits complex multi-vendor stacks better.
Even with significant technology investment, many organizations fail to convert data into trusted operational understanding because of integration complexity and disconnected signals. The investment in integration work is where the real value is created.
Estimated timeline and cost drivers:
| Phase | Timeline | Primary Cost Drivers |
|---|---|---|
| Pilot (2 journeys, core KPIs) | 4 weeks | Integration engineering, platform licensing, data governance setup |
| Scale (full journey coverage) | 3 months | Additional integrations, role-specific dashboard builds, training |
| Steady state | ongoing | Platform licensing, governance maintenance, continuous iteration |
Cost varies significantly by stack complexity, the number of third-party integrations required, and whether you build internally or engage a managed partner. Choosing an operational services partner can compress the timeline and reduce the internal engineering burden, particularly for organizations without a dedicated observability team.
How does a CX operations partner operationalize visibility?
A managed partner approach combines nearshore team deployment with disciplined execution frameworks and measurable performance agreements, which is how organizations move from a visibility pilot to a sustained operational capability without building a dedicated internal team from scratch.

The Altiamcx approach centers on three elements: nearshore teams trained to operate within defined runbooks and SLA frameworks, instrumented dashboards aligned to client-specific KPIs, and a governance cadence that reviews threshold performance and adjusts alerting logic on a regular cycle.
Clients working within a managed visibility framework can expect outcomes such as reduced customer-impact minutes per incident, improved agent first-contact resolution rates, and faster SLA breach detection. For a concrete example of what this looks like in practice, the Altiamcx case study on tech support migration shows how a software platform improved support productivity by 89% after moving to a managed nearshore model with defined operational frameworks.
Specialized CX operations deliver measurable results precisely because visibility, runbooks, and accountability are built into the operating model from day one, not added after problems surface.
The visibility work that actually moves the needle
Most operations leaders I speak with already know they have a visibility problem. What they underestimate is how much of the solution is organizational rather than technical. The teams that make the fastest progress don’t start by evaluating platforms. They start by picking one critical journey, mapping its dependencies on a whiteboard, and asking a simple question: “Where do we have no signal today?”
That question usually surfaces two or three integration gaps that, once closed, produce more decision value than any new tool purchase. My recommendation is to run a focused two-week visibility sprint on your highest-volume customer journey before committing to any platform investment. Involve your CCaaS owner, your CRM admin, and one network engineer. The output should be a dependency map, a list of instrumentation gaps, and a draft KPI set. That’s the foundation everything else builds on.
Altiamcx delivers operational visibility as a managed capability
Operational visibility programs stall when they run out of internal engineering bandwidth or when the governance work gets deprioritized. Altiamcx removes both constraints by providing nearshore CX and operations teams that arrive with instrumented runbooks, role-specific dashboards, and measurable SLA frameworks already built into the engagement model.

For operations leaders who need faster MTTR, cleaner SLA compliance, and a team that operates from the same real-time view as your internal leadership, Altiamcx offers a managed path that skips the 6-month build phase. The tech support migration case study shows an 89% productivity improvement after transitioning to a managed nearshore model with defined operational frameworks. If you’re ready to move from a visibility gap to a working capability, contact Altiamcx to scope a pilot engagement around your most critical customer journey.
Sources
The claims and frameworks in this article draw on the following sources. Each is worth reading for deeper technical detail or industry benchmarks.
- Why real-time operational visibility is replacing monthly reporting
- CX observability gaps: Why CX failures aren’t random
- The Visibility Problem Nobody Talks About in CX
- Operational Visibility — OWASP Product Security
- Your cloud contact center has a blind spot. It’s bigger than you think.
- From Guessing to Knowing: The Case for Operational Clarity — Jeff Winter
- What Is Operational Visibility? How Does AI Help? — NetSuite