
TL;DR:
- Measuring service quality involves frameworks like SERVQUAL and perception metrics such as CSAT, NPS, and CES to identify gaps between customer expectations and experiences. Combining operational KPIs with perceptions and qualitative audits enables organizations to pinpoint weaknesses and implement targeted improvements. Continuous interpretation and disciplined action transform data into meaningful service enhancements that drive customer loyalty and operational efficiency.
Service quality measurement is the process of assessing how well your service meets or exceeds customer expectations through structured frameworks and quantifiable performance metrics. Business leaders who understand how to measure service quality gain a direct line of sight into operational gaps, customer loyalty risks, and the specific interactions that either build or erode trust. The industry standard for this discipline draws on the SERVQUAL model, alongside metrics like CSAT, NPS, and CES, to capture both the psychological and operational dimensions of service delivery. This guide gives you a practical, cross-industry roadmap for measuring service quality with precision and purpose.
How to measure service quality: core frameworks and models
The most widely used framework for service quality assessment is SERVQUAL, developed by Parasuraman, Zeithaml, and Berry. SERVQUAL measures five dimensions using 22 paired survey items that compare customer expectations against actual perceptions. A negative gap score signals that service fell short of what customers anticipated. That gap analysis is what makes SERVQUAL more than a satisfaction survey. It tells you where the failure occurred, not just that it occurred.
The five dimensions, known by the acronym RATER, are:
- Reliability: Delivering promised services accurately and consistently
- Assurance: Staff knowledge, courtesy, and ability to convey trust
- Tangibles: Physical facilities, equipment, and staff appearance
- Empathy: Individualized attention and genuine care for customers
- Responsiveness: Willingness to help and provide prompt service
Service quality is fundamentally a psychological experience, rooted in the expectancy-disconfirmation paradigm. Customers form a mental model of what good service looks like before they interact with you. Your measurement program must account for that mental model, not just the transaction outcome.
One practical limitation worth knowing: SERVQUAL requires two rounds of 22 questions, which creates real survey fatigue. Many organizations now use SERVPERF, a simplified adaptation that measures perceptions only, cutting the survey length in half while preserving most of the diagnostic value. For teams with limited survey bandwidth, SERVPERF is the more sustainable starting point.

Pro Tip: Start with SERVPERF if your team is new to structured service quality assessment. Once you have baseline perception scores across the five RATER dimensions, layer in expectation data for the one or two dimensions where your scores are lowest.
Which metrics best capture service quality and customer perceptions?
No single number tells the full story of service quality. Effective organizations capture both “how fast” and “how satisfied” in their metric sets, combining operational KPIs with customer perception scores.
The three primary perception metrics are:
- CSAT (Customer Satisfaction Score): Measured on a 1 to 5 scale, CSAT captures immediate satisfaction after a specific interaction. It is fast to collect and easy to segment by channel, agent, or issue type.
- NPS (Net Promoter Score): Measured on a scale of negative 100 to positive 100, NPS reflects customer advocacy and long-term loyalty. A high NPS indicates customers are likely to recommend your service, which is a leading indicator of retention and growth.
- CES (Customer Effort Score): Measured on a 1 to 7 scale, CES quantifies how much effort a customer had to exert to resolve their issue. Lower effort scores correlate directly with higher loyalty.
The operational metrics that complement these perception scores include:
| Metric | What it measures | Why it matters |
|---|---|---|
| First Contact Resolution (FCR) | Issues resolved in a single interaction | Reduces repeat contacts and customer frustration |
| First Response Time (FRT) | Time to first agent reply | Sets the tone for the entire service experience |
| Average Handle Time (AHT) | Duration of a service interaction | Efficiency proxy, but must be paired with quality thresholds |
| Retention Rate | Customers who remain over a period | Downstream indicator of sustained service quality |
Focusing on customer effort and next issue avoidance is increasingly recognized as a stronger predictor of service quality than response speed alone. Customers who are forced through multiple steps to resolve a single issue report poor service even when agents are fast and polite. CES captures this friction in a way that CSAT and NPS often miss.
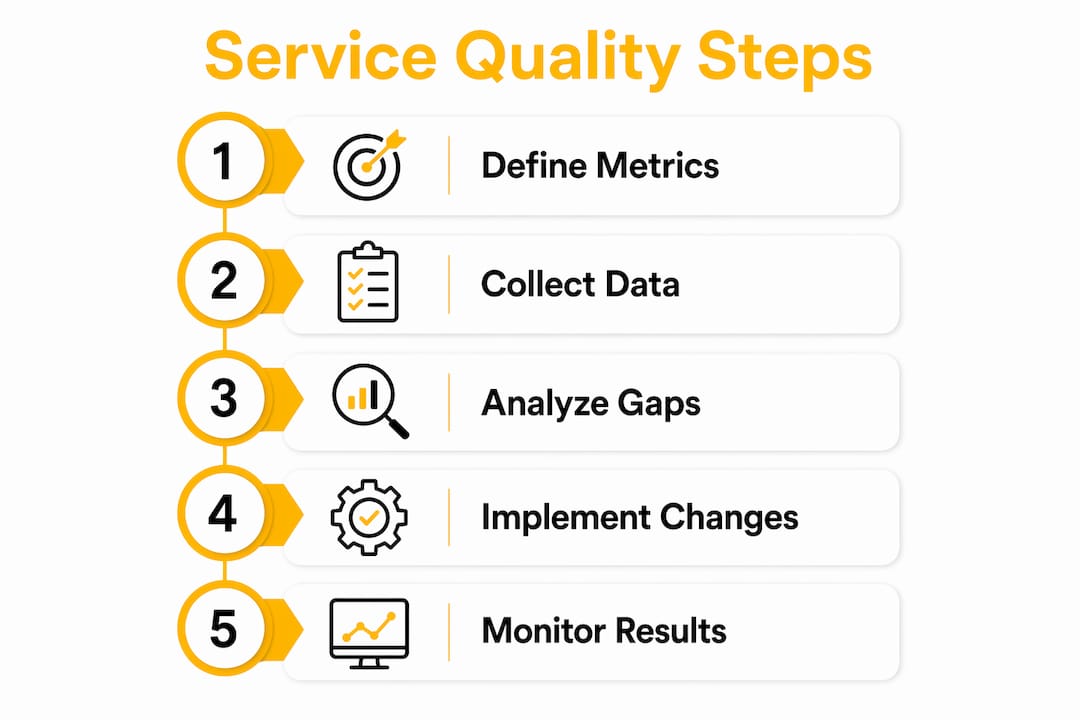
How to implement a service quality measurement program
A measurement program without a clear structure produces data that no one acts on. Follow these steps to build one that generates decisions, not just reports.
-
Define your measurement goals. Align each metric to a specific business objective. If your goal is to reduce churn, prioritize NPS and retention rate. If your goal is to reduce operational cost, prioritize FCR and AHT paired with CSAT thresholds.
-
Select your metrics and tools. Choose a combination of perception metrics (CSAT, NPS, CES) and operational KPIs (FCR, FRT, AHT). Tools like Salesforce Service Cloud, Zendesk, and Medallia all support automated data collection and dashboard reporting for these metrics.
-
Design your survey instruments. Keep surveys short. Three to five questions per interaction is the practical ceiling for maintaining response rates. Use validated question formats for CSAT, NPS, and CES rather than writing custom scales that cannot be benchmarked.
-
Set your measurement cadence. Operational metrics like FRT and FCR should be tracked daily, experience metrics like CSAT weekly, and business-impact metrics like NPS and retention rate monthly. This tiered cadence gives you both real-time visibility and strategic trend data.
-
Collect data across multiple channels. Transaction surveys, mystery shopping, complaint analysis, and social listening each capture a different slice of service quality. No single channel gives you the full picture.
-
Analyze gaps and prioritize improvements. Use SERVQUAL gap scores to identify which of the five RATER dimensions is underperforming. Cross-reference with operational KPIs to find the root cause. Then prioritize fixes by the combination of gap severity and customer impact.
Pro Tip: Send transaction surveys immediately post-interaction while the experience is still fresh. Response rates and accuracy both drop significantly when surveys arrive hours or days later.
What common challenges arise when measuring service quality?
Even well-designed measurement programs run into predictable problems. Knowing them in advance lets you build around them.
Relying on a single metric is the most common mistake in service quality programs. A team that tracks only handle time will optimize for speed at the expense of resolution quality. A team that tracks only CSAT will miss systemic friction that customers tolerate but eventually leave over. Robust programs combine quantitative KPIs with customer perception data.
“Balance objective data like FCR and resolution time with subjective data like NPS and CSAT. Neither category alone tells you whether your service is actually working.”
Measuring volume alone incentivizes speed over quality. A practical fix is to set paired thresholds. For example, target a six-minute average handle time only if CSAT remains above 85%. This structure prevents agents from rushing through interactions to hit efficiency targets while customer satisfaction quietly deteriorates.
Additional challenges to address:
- Survey fatigue: Sending too many surveys reduces response rates and skews results toward extreme opinions. Rotate survey timing and limit frequency per customer.
- Inconsistent metric definitions: If one team counts FCR as resolution within 24 hours and another counts it as resolution on the first call, your data is not comparable. Standardize definitions before you start collecting.
- Data silos: When customer feedback lives in the CRM, operational data lives in the ticketing system, and complaint data lives in email, no one sees the full picture. Integrate your data sources into a single reporting layer.
Qualitative audits are the underused tool in most measurement programs. Analyzing conversation transcripts reveals friction points that numeric scores cannot surface. A CSAT score of 3.8 out of 5 tells you customers are mildly dissatisfied. A transcript audit tells you they are frustrated because agents cannot access order history without transferring the call.
How to interpret results and improve service quality continuously
Data collection is not the goal. The goal is the decision that follows. Here is how to translate measurement results into service improvements that compound over time.
Start with your SERVQUAL gap scores. The dimension with the largest negative gap is your highest-priority improvement area. If Responsiveness scores are consistently low, the problem is likely staffing levels, routing logic, or agent availability, not training or attitude. If Empathy scores are low, the problem is more likely script rigidity or agent coaching.
Use your operational KPIs to validate the hypothesis. If Responsiveness gaps correlate with high FRT on specific channels or shifts, you have located the operational cause. If Empathy gaps correlate with low CSAT scores on complex issue types, you have identified a training need.
The continuous improvement cycle looks like this:
- Measure: Collect CSAT, NPS, CES, FCR, and FRT on a defined cadence
- Analyze: Compare against baselines and benchmarks; identify the largest gaps
- Act: Implement targeted changes to process, staffing, training, or technology
- Re-measure: Assess whether the change moved the metric in the intended direction
- Share: Distribute results across teams so every department understands its role in service quality
Combining quantitative metrics with qualitative audits gives you the “what” and the “why” simultaneously. Organizations that build this dual-track approach into their regular operating rhythm improve faster than those relying on scores alone. For a deeper look at how evidence-based service strategies translate measurement into CX outcomes, the connection between data and action is where most programs either succeed or stall.
Key takeaways
Measuring service quality requires combining structured frameworks like SERVQUAL with perception metrics like CSAT and NPS, operational KPIs like FCR and FRT, and qualitative audits to identify and close the gaps between what customers expect and what they actually receive.
| Point | Details |
|---|---|
| Use SERVQUAL or SERVPERF as your foundation | The RATER dimensions give you a structured map of where service gaps exist across five measurable areas. |
| Combine perception and operational metrics | Pair CSAT, NPS, and CES with FCR, FRT, and AHT to capture both customer feelings and operational reality. |
| Set paired thresholds, not isolated targets | Tie efficiency metrics like AHT to quality floors like CSAT above 85% to prevent speed from undermining satisfaction. |
| Time surveys immediately post-transaction | Fresh feedback is more accurate and yields higher response rates than delayed outreach. |
| Add qualitative audits to your program | Transcript and complaint analysis surfaces friction points that numeric scores alone cannot explain. |
Why measurement without interpretation is just noise
I have worked with organizations that had dashboards full of metrics and still could not tell you why their customer satisfaction scores were declining. The data was there. The interpretation was not.
The most common trap I see is treating measurement as the destination rather than the starting point. Teams spend months selecting the right survey tool, debating NPS versus CSAT, and building reporting infrastructure. Then the data arrives and no one has a clear process for deciding what to do with it. The metrics become a reporting exercise rather than a decision-making tool.
My honest view is that the framework matters less than the discipline. Whether you use SERVQUAL, SERVPERF, or a custom combination of KPIs, what separates high-performing service organizations is the commitment to act on what the data reveals, even when the findings are uncomfortable. Low Empathy scores often point to management culture, not just agent behavior. High AHT on complex issues often points to broken internal processes, not slow agents. The data will tell you the truth if you are willing to hear it.
I also push back on the idea that more metrics equal better insight. Start with three to five metrics that directly connect to your top business objectives. Master those before adding complexity. The operational services framework that works in practice is always simpler than the one that looks impressive in a slide deck.
— Daniela
How Altiam CX helps you build a measurement program that delivers results
Translating service quality frameworks into daily operational practice requires more than a good methodology. It requires the right partner.

Altiam CX works with business leaders to design and execute service quality measurement programs that connect CSAT, NPS, CES, and operational KPIs to real performance outcomes. The Altiam CX approach combines disciplined measurement cadences, conversation auditing, and SLA tracking within a performance framework built for scalability. One software platform that migrated tech support to Altiam CX saw productivity improve by 89% after implementing structured quality measurement alongside nearshore team support. If your current program is generating data without generating decisions, Altiam CX can help you close that gap.
FAQ
What is the SERVQUAL model and why does it matter?
SERVQUAL is a service quality assessment framework that measures the gap between customer expectations and perceptions across five dimensions: Reliability, Assurance, Tangibles, Empathy, and Responsiveness. A negative gap score in any dimension identifies a specific area where service delivery falls short of what customers anticipated.
What is the difference between CSAT, NPS, and CES?
CSAT measures satisfaction with a specific interaction on a 1 to 5 scale, NPS measures overall customer advocacy on a scale of negative 100 to positive 100, and CES measures how much effort a customer had to exert to resolve an issue on a 1 to 7 scale. Each metric captures a different dimension of the customer experience, which is why effective programs use all three together.
How often should you measure service quality?
Operational metrics like First Response Time and First Contact Resolution should be tracked daily, experience metrics like CSAT weekly, and business-impact metrics like NPS and retention rate monthly. This tiered cadence provides both real-time visibility and long-term trend data.
What is the biggest mistake in service quality measurement?
Relying on a single metric is the most common error. Tracking only speed metrics drives agents to prioritize efficiency over resolution quality, while tracking only satisfaction scores misses the operational root causes of poor service.
How do qualitative audits improve service quality measurement?
Conversation transcript analysis and complaint reviews reveal the specific friction points and process failures that numeric scores cannot explain. Pairing qualitative audits with CSAT and NPS data gives you both the magnitude of a service gap and the operational reason behind it.