
Rising support volume degrades service quality by default. Response times climb, first-contact resolution drops, and consistency erodes unless you adjust capacity, triage, and automation containment in step with demand. Industry benchmarks put average agent workloads at 17 to 25 tickets per agent per day, and automation now deflects 40% to 70% of tier-one volume at mature organizations, yet human-handled ticket counts often stay flat or rise anyway. Three moves stabilize quality while you read the rest of this guide:
- Enable emergency triage to route high-value or high-risk tickets ahead of routine requests.
- Tighten SLAs on priority routes so your best agents aren’t buried under low-complexity noise.
- Publish an urgent self-service page covering the top three issues driving the spike.
Key Takeaways
Rising support volume reduces response speed, first-contact resolution, and consistency unless staffing, triage, and automation containment scale together.
| Point | Details |
|---|---|
| Volume signals problems early | Rising tickets-per-customer often points to product friction before churn data confirms it. |
| Watch KPI combinations, not single metrics | Rising AHT with falling FCR signals complexity growth, not just queue delays. |
| Triage before you hire | Emergency triage and priority routing stabilize SLAs faster than headcount additions. |
| Separate deflection from containment | First-contact deflection can rise while true end-to-end containment stays flat. |
| Nearshore overflow adds flexible capacity | Altiamcx offers bilingual, scalable agent capacity for peak demand without permanent overstaffing. |
Table of Contents
- What Counts as Support Volume, and What to Track
- How Rising Volume Actually Breaks Service Quality
- Which KPIs Move First When Volume Rises
- How to Measure and Monitor Volume Before It Breaks You
- A Playbook for Protecting Quality as Volume Grows
- What a Telecom Study Reveals About Volume and Trust
- Where a Managed Nearshore Partner Fits Into the Picture
- Sources
What Counts as Support Volume, and What to Track
Support volume means every incoming customer contact across channels, phone, chat, email, social, and self-service, not just tickets that land in an agent’s queue. A contact that gets fully resolved by a bot counts differently than one that reaches a live agent, so leaders need to separate first-contact counts from contained interactions.
Track these dimensions, not just the raw total:
- Tickets per agent per day (benchmark: 17 to 25)
- Tickets per customer (a rising ratio signals product friction, not just growth)
- Channel breakdown (phone vs. chat vs. email shift cost and speed differently)
- Containment or deflection rate
- Escalation rate to tier-two or specialists
- Peak multiplier (weekday high divided by average day)
Tickets-per-customer matters more than most dashboards admit. If tickets grow 30%, something in the product or experience is generating avoidable contacts.
How Rising Volume Actually Breaks Service Quality
Volume doesn’t degrade quality through one mechanism. It stacks several failure modes at once, and each one makes the next one worse.
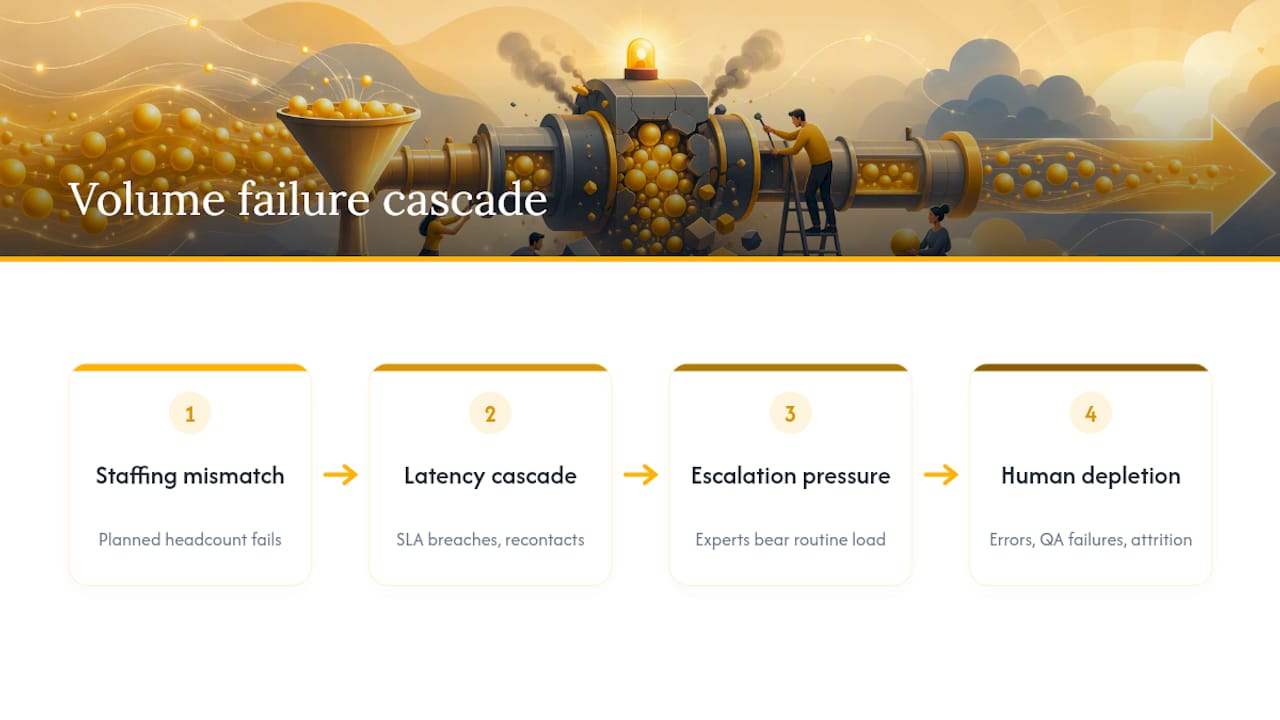
Staffing mismatch comes first. Headcount planned for average load fails the moment volume spikes, because agents sitting idle during quiet hours can’t be conjured instantly during a surge. Adding bodies without changing decision authority or workflow often backfires. One operational analysis found rapid hiring during a scale-up actually increased average response time because new agents added coordination overhead faster than they added capacity.
Latency cascades next. Longer queue waits don’t just annoy customers in the moment. They push tickets past SLA windows, which triggers re-contacts, which adds more volume on top of the original spike. It’s a feedback loop, not a one-time hit.
Escalation concentrates pressure. As routine issues pile up, complex ones get shuffled to your most experienced agents, who are already stretched. That’s how a tier-two team of five ends up carrying the weight of a tier-one team of fifty.
Human factors follow. Agents under sustained overload make more decision errors, fail more QA checks, and burn out faster, which raises attrition right when you need experienced staff most.
Consider a product outage that multiplies ticket volume two to five times overnight. Response times blow past SLA within hours. Agents start triaging on gut feel instead of process. By the time the outage is fixed, the support backlog can take longer to clear than the outage itself.
Which KPIs Move First When Volume Rises
Volume changes show up in your dashboard before anyone says a word in a meeting, if you know where to look.
- Response time rises first and fastest, often before any other metric moves.
- Average handle time (AHT) climbs if ticket complexity increases, stays flat if it’s pure volume.
- First contact resolution (FCR) drops when agents rush or when complexity outpaces training.
- CSAT and NPS lag by days but fall hardest after repeated SLA misses.
- SLA compliance is your cleanest early-warning signal.
- Agent utilization and attrition move slower but signal structural strain.
The combination matters more than any single number. Rising AHT paired with falling FCR points to complexity growth, not just queue delays, which calls for training and triage fixes rather than more headcount. A short-term dip after a known event (a product launch, a seasonal peak) doesn’t justify a hiring spree. A sustained multi-week decline does. Don’t let a single bad week trigger a permanent staffing decision.
How to Measure and Monitor Volume Before It Breaks You
A dashboard built for support volume should track tickets per hour, tickets per customer, containment rate, escalation rate, per-channel response latency, and backlog age buckets (how many tickets are older than 24, 48, and 72 hours).
Set alert thresholds that trigger action, not just observation:
- Week-over-week ticket growth above 20%
- Containment rate drop of 10 percentage points or more
- Agent utilization above 85% sustained for two or more weeks
Pro Tip: Report containment in two separate numbers: first-contact deflection (what the bot or self-service page caught before a human touched it) and full end-to-end containment (what never came back as a re-contact). Automation frequently improves the first number without moving the second, and leaders who conflate the two overestimate how much relief their automation investment is actually delivering.
For a deeper walkthrough of which metrics matter to executives versus floor managers, see how to measure service quality.
A Playbook for Protecting Quality as Volume Grows
Treat this as a timeline, not a single fix. Different problems need different response speeds.
Immediate (hours to days):
- Activate emergency triage rules that route by urgency and customer value, not arrival time.
- Redirect overflow to a temporary queue with clear escalation criteria.
- Publish or update a self-service page addressing the top drivers of the spike.
- Run a fast QA pass on canned responses to catch errors before they multiply across hundreds of tickets.
Short (days to weeks):
- Cross-train adjacent staff to absorb overflow without a full hiring cycle.
- Tighten triage rules based on what’s actually driving volume, not last quarter’s assumptions.
- Tune your knowledge base and bot flows to raise containment, not just deflection.
- Shift schedules to match observed peak hours instead of a flat coverage model.
- Bring in temporary contract or nearshore capacity for the overflow tail.
Medium (weeks to months):
- Rebuild your staffing model around a core team plus flexible overflow rather than one fixed headcount number, about 54% of leaders already lean on outsourced or contract agents for this exact variability.
- Revise onboarding so new agents get real decision authority faster, not just scripts.
- Rework escalation paths so specialists only see genuinely specialized problems.
Long (months and beyond):
- Build a telemetry-to-support feedback loop so product issues get flagged before they generate hundreds of tickets.
- Layer in predictive analytics to flag at-risk accounts or emerging issues proactively.
- Redesign the workflows or product surfaces that generate the most avoidable contacts.
Pro Tip: Size your core-plus-overflow blend against your peak multiplier, not your average day. A team staffed for average load and stretched to cover peaks with mandatory overtime burns out your best people first, and they’re the hardest to replace. Compare a core-plus-overflow model against a seasonal-only model: the former keeps institutional knowledge intact year-round, while the latter saves on off-peak cost but pays for it in ramp-up time every time volume spikes. For deeper process detail, review how to scale support teams without sacrificing efficiency.
What a Telecom Study Reveals About Volume and Trust
Responsiveness, network reliability, and perceived value are the primary drivers of customer satisfaction, and slow support resolution significantly erodes trust, according to a telecommunication service-quality study that found roughly 36% of surveyed customers reporting regular connectivity issues and about 26% reporting recurring outages.
The lesson generalizes past telecom. When responsiveness drops during a volume spike, customers don’t just get annoyed. They stop trusting that the issue will get fixed at all, which is a harder problem to reverse than a slow ticket.
- Automation deflection commonly runs 40% to 70% of tier-one volume at organizations that have matured their self-service, but that range only holds if bots are tuned against real complaint patterns.
- Proactive outreach based on telemetry, flagging an outage or degraded service before customers notice, can head off complaint volume rather than absorb it after the fact.
The operational move: connect product and network telemetry directly to your routing logic, so predictive alerts trigger staffing or self-service updates before the ticket wave hits.
An Ops Leader’s View on Volume Spikes
During one product outage, ticket volume tripled overnight. Emergency triage, not extra headcount, kept SLA breaches contained. Predictive routing came later and cut the next spike’s severity in half.

Where a Managed Nearshore Partner Fits Into the Picture
Most of the playbook above, triage, forecasting, telemetry integration, you can build in house. Where teams consistently struggle is the overflow capacity itself: finding bilingual agents fast, keeping quality consistent under peak demand, and not overcommitting to permanent headcount for a spike that might not repeat.

That’s the specific gap Altiamcx is built to close. As a nearshore CX and team-extension partner, Altiamcx provides scalable, bilingual agent capacity that plugs into your existing workflows during growth spurts without the multi-quarter hiring cycle a permanent expansion requires. One software platform that moved its technical support to Altiamcx saw productivity improve by 89% in a documented case study, a useful reference point if you’re weighing outsourced overflow against internal scaling. If your volume curve looks anything like the outage example above, a capacity and scaling assessment with Altiamcx is a reasonable next step, and you can see how it applies specifically to fast-growth environments on the fast-growth tech CX page.
Sources
- Support Ticket Volume: The Critical Metric That Can Transform Your Customer Service Strategy
- Service Quality Evaluation in a Telecommunication Service Provider