
Customer experience (CX) metrics are the measurable signals that connect shopper behavior directly to revenue — and the retailers who track the right ones consistently outperform those who rely on instinct alone. The core argument is straightforward: metrics like conversion rate, average transaction value (ATV), and retention rate are not just diagnostic tools. They are operational levers. Improve them deliberately, and revenue follows. Ignore them, and you are managing a store by feel in a market that rewards precision.
The immediate action for any retail manager reading this: pick two or three outcome-linked metrics, tie each one to a specific daily operation, and measure them weekly. Start there.
Why retail CX metrics matter — the business case at a glance:
- Revenue lift: Higher conversion rates and ATV translate directly to top-line growth without adding foot traffic.
- Repeat visits: Retention and repeat purchase rate are the clearest indicators of loyalty — and loyal customers cost far less to serve than new ones.
- Operational efficiency: Metrics like Customer Effort Score (CES) and first-contact resolution time expose friction points that inflate service costs and erode margins.
- Smarter staffing: High-frequency behavioral signals reveal when store execution pressure is building before satisfaction scores drop.
Key Takeaways
Retail CX metrics matter because they are the direct, measurable link between shopper experience and revenue, retention, and operational cost — and the retailers who act on them consistently outperform those who do not.
| Point | Details |
|---|---|
| Start with outcome metrics | Conversion rate, ATV, and repeat purchase rate connect directly to revenue and should anchor any starter scorecard. |
| Combine attitudinal and behavioral data | Survey scores explain why performance shifts; behavioral data confirms the financial scale — you need both to act with confidence. |
| The effort-to-loyalty cascade is real | Reducing customer effort drives experience quality, which drives satisfaction, which drives loyalty — prioritize friction removal first. |
| Fewer, better-connected metrics win | A focused scorecard tied to journey stages and owned by named managers outperforms a large disconnected dashboard every time. |
| Altiamcx accelerates execution | Nearshore managed teams and performance frameworks help retail organizations close the gap between CX insight and frontline action at scale. |
Table of Contents
- What are CX metrics and how should retail managers think about them?
- Which CX metrics actually drive retail outcomes?
- How do CX improvements translate into real revenue?
- Which metrics should you prioritize first?
- What measurement mistakes do retail teams make most often?
- What does recent industry data say about U.S. retail CX performance?
- How can a managed CX partner help retail teams act on metrics?
- Altiamcx turns retail CX data into measurable business outcomes
- Sources
What are CX metrics and how should retail managers think about them?
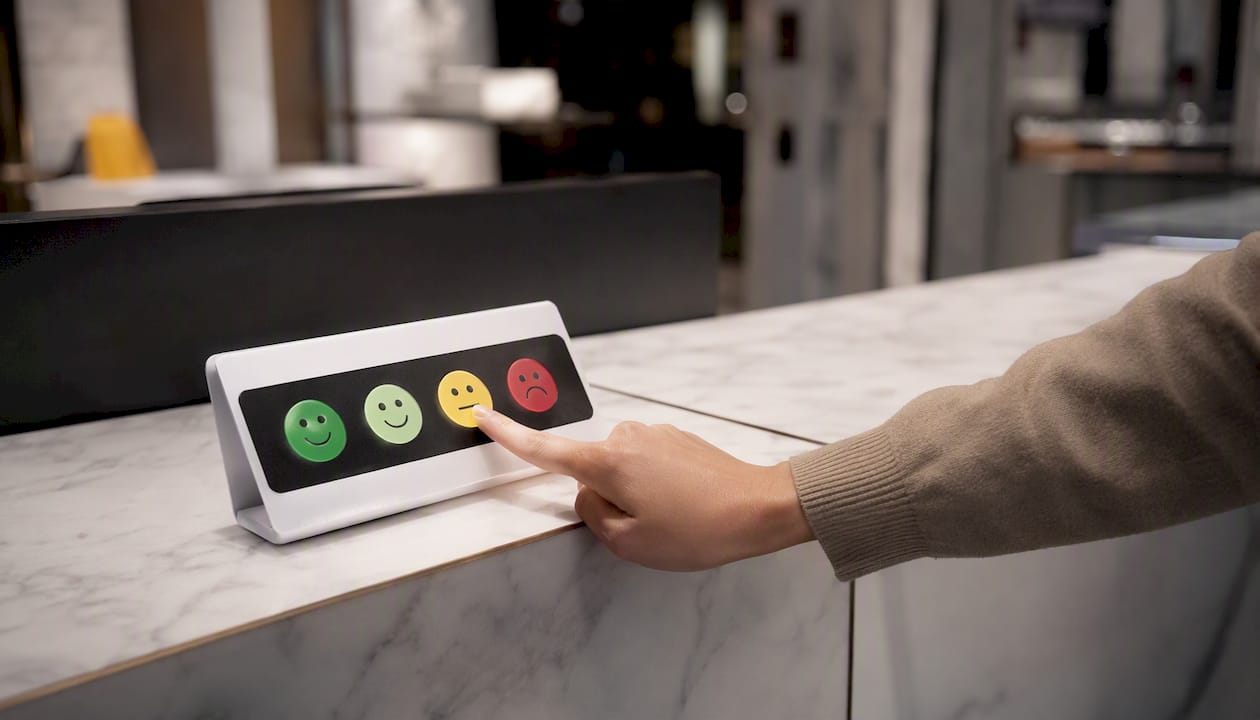
Customer experience metrics are measurable indicators of how shoppers perceive and interact with your brand across every touchpoint — and how those perceptions translate into purchasing behavior and financial outcomes. The standard industry term is CX measurement, and it covers two distinct but complementary categories: attitudinal metrics and behavioral metrics.
Attitudinal metrics capture what customers feel — their satisfaction, loyalty intent, and perceived effort. Behavioral metrics capture what customers do — whether they bought, returned, came back, or abandoned a cart. Both matter. Attitudinal data explains why something is happening; behavioral data confirms that it is happening and at what scale.
| Dimension | Attitudinal Metrics | Behavioral Metrics |
|---|---|---|
| What it measures | Perceptions, sentiment, loyalty intent | Purchases, returns, visits, abandonment |
| Retail examples | NPS, CSAT, CES | Conversion rate, ATV, repeat purchase rate |
| Typical data source | Post-transaction surveys, text analytics | POS, e-commerce analytics, CRM/loyalty |
| When to prioritize | Diagnosing why satisfaction is falling | Quantifying revenue and retention impact |
The mistake most retail teams make is treating these two categories as alternatives. They are not. A high NPS score alongside a declining repeat purchase rate is a warning sign, not a success story. You need both lenses to get an accurate picture of what is driving — or dragging — performance.
Which CX metrics actually drive retail outcomes?
The CX metrics that move retail performance fall into three clusters: revenue drivers, loyalty indicators, and operational health signals. Here is a practical breakdown of each, with data sources and one immediate action per metric.
Revenue drivers
- Conversion rate: The percentage of store visitors or site sessions that result in a purchase. Source: POS traffic counters, e-commerce analytics. Action: Map conversion by hour and associate it with staffing levels to identify under-served peak windows.
- Average transaction value (ATV): Total revenue divided by number of transactions. Source: POS. Action: Test targeted upsell prompts at checkout and measure ATV change week over week. As TruRating notes, winning retailers reframe CX KPIs as business KPIs — ATV and conversion belong at the center of any CX scorecard.
- Units per transaction (UPT) / basket size: Average number of items per purchase. Source: POS. Action: Identify product adjacencies where UPT is low and adjust shelf placement or bundle offers.
- Basket abandonment rate: Percentage of initiated carts or baskets not completed. Source: e-commerce analytics, self-checkout data. Action: Trigger a recovery email or SMS within one hour of abandonment for online channels.
Loyalty indicators
- Repeat purchase rate / retention rate: Share of customers who return within a defined window. Source: CRM/loyalty program. Action: Segment by recency and run a targeted re-engagement offer for customers who have not returned in 60 days.
- Customer Lifetime Value (CLV): Projected total revenue from a customer over their relationship with your brand. Source: CRM, transaction history. Action: Identify your top CLV decile and survey them specifically to understand what keeps them loyal.
- Net Promoter Score (NPS): Likelihood to recommend, on a 0–10 scale. Source: post-transaction or periodic surveys. Action: Pair NPS with text analytics to surface the specific drivers behind detractor scores, rather than tracking the number alone.
Operational health signals
- Customer Satisfaction Score (CSAT): Immediate satisfaction rating, typically post-interaction. Source: in-store kiosks, post-call surveys, digital receipts. Action: Set a CSAT threshold for each store and trigger a manager review when weekly scores fall below it.
- Customer Effort Score (CES): How easy it was to complete a task — find a product, resolve a return, navigate checkout. Source: post-transaction surveys. Gartner recommends defining the specific task clearly before deploying CES to keep results comparable across periods.
- First response / resolution time: How quickly service issues are acknowledged and resolved. Source: CRM, helpdesk, call center data. Action: Set SLA targets by channel and report resolution time alongside CSAT to see whether speed correlates with satisfaction in your context.
A note on segmentation: grocery and apparel require different metric priorities. Grocery managers should weight conversion rate, basket size, and in-store execution pressure heavily, given high visit frequency and thin margins. Apparel managers typically get more signal from ATV, UPT, and return rate, where a single high-value transaction can swing weekly performance. For ecommerce-specific measurement, basket abandonment and post-purchase CSAT carry additional weight.
How do you collect reliable CX data across your retail operation?
Reliable measurement starts with connecting the right data sources to the right metrics — and knowing how often to look at each one.
Primary data sources:
- POS systems: Conversion, ATV, UPT, basket size, return rate. Refresh daily.
- E-commerce analytics (Google Analytics 4, Adobe Analytics): Basket abandonment, session-to-purchase conversion, page-level drop-off. Refresh daily.
- CRM / loyalty platforms: Repeat purchase rate, CLV, recency-frequency-monetary (RFM) segmentation. Refresh weekly.
- Survey tools (Medallia, Qualtrics, SurveyMonkey): CSAT, NPS, CES. Collect in-the-moment for transactional surveys; run relationship NPS quarterly.
- Text analytics: Open-ended survey responses, review platforms, social listening. Process weekly or after significant operational changes.
- Returns and fulfillment systems: Return rate, reason codes, fulfillment accuracy. Refresh weekly.
- Behavioral signals: Cart abandonment events, search-with-no-results rates, dwell time. Refresh daily for e-commerce; weekly for physical stores.
Sampling and frequency guidance: For in-store CSAT, aim for a minimum of 30 responses per store per week before drawing conclusions. Post-transaction surveys should fire within 24 hours of purchase to capture accurate recall. NPS is best measured quarterly at the relationship level, not after every transaction, to avoid survey fatigue. For high-frequency behavioral feedback, HappyOrNot’s analysis of 18.7 million in-store responses shows that operational pressure patterns become visible at scale — the more responses you collect, the earlier you can forecast CX degradation before it shows up in satisfaction scores.
Data quality checklist:
- Deduplicate customer records before calculating CLV or repeat purchase rate.
- Link survey responses to transaction IDs so attitudinal scores can be compared against behavioral outcomes for the same customer.
- Validate event-level accuracy monthly: spot-check POS data against financial reports to catch miscoded transactions.
Pro Tip: Before adding a new survey question, ask whether the answer would change a specific operational decision within 30 days. If not, cut the question. As MIT Sloan Management Review argues, fewer, better-connected metrics consistently outperform large disconnected scorecards.
How do CX improvements translate into real revenue?
The path from a CX signal to a dollar outcome follows a predictable loop: measure → diagnose → pilot an operational fix → quantify the revenue or retention impact → scale. Each step is only as strong as the data feeding it.
Here is how the loop works in practice:
- Measure: Weekly conversion rate for a five-store cluster drops from 32% to 28%.
- Diagnose: CSAT scores for “ease of finding products” fall in the same window. Text analytics surface “couldn’t find staff” as the top complaint theme.
- Pilot: Shift two associates from back-of-house to the floor during the 11 AM–2 PM window for two weeks.
- Quantify: Conversion recovers to 31%. At an ATV of $65 and 400 daily transactions per store, a 3-point conversion recovery across five stores adds roughly $39,000 in monthly revenue.
- Scale: Roll the staffing adjustment to all 20 stores in the region.
That calculation is deliberately simple — real numbers will vary by store size, category, and traffic volume. The point is that a modest, measurable CX improvement at the store level compounds quickly across a fleet.
The academic evidence supports the upstream investment logic. A 2025 PLS-SEM study of 359 online shoppers found significant positive paths from customer effort reduction through experience quality and satisfaction, ultimately driving loyalty and advocacy. Reduce friction first; satisfaction and NPS follow.
The cascade that matters for retail: Lower customer effort → better experience quality → higher satisfaction → stronger loyalty and advocacy. Investing in ease of interaction is not a soft initiative — it is a measurable driver of repeat revenue.
Forrester’s analysis reinforces the fundamentals argument: retailers that strengthened product assortment, in-stock reliability, and employee experience saw better CX outcomes and loyalty scores. The average Total Experience Score across retailers was 59.1 out of 100, leaving substantial room for improvement — and the brands that moved the needle did so by fixing operational basics, not by launching new loyalty programs.
Which metrics should you prioritize first?
Not every retailer needs to measure everything at once. Use this three-question decision framework to focus your effort:
- Which metric ties directly to our immediate business goal? If the goal is revenue growth, start with conversion rate and ATV. If it is retention, start with repeat purchase rate and CLV. If it is cost reduction, start with CES and first-contact resolution time.
- Do we have reliable, accessible data to act on this metric? A metric you cannot trust is worse than no metric — it produces false confidence. Confirm the data source is clean before building a KPI around it.
- Can frontline teams actually influence this metric within 30 days? If the answer is no, the metric belongs in a strategic dashboard, not a weekly store operations report.
Starter KPI sets by priority:
- High-impact starter set (weeks 1–4): Conversion rate, ATV, CSAT. These three give you revenue signal, transaction quality, and immediate satisfaction feedback with minimal setup.
- Operational health set (weeks 5–8): CES, first-contact resolution time, basket abandonment. Add these once the starter set is stable and you need to diagnose friction points.
- Brand health set (quarter 2 onward): NPS, CLV, repeat purchase rate. These require longer data windows and more sophisticated analysis to be actionable.
Expect to see meaningful signal from the starter set within four to six weeks of consistent measurement. CLV and NPS trends typically require a full quarter before they are statistically reliable enough to drive decisions. Retail CX improvement timelines vary by store type and baseline data quality, but the pattern holds: operational metrics move faster than relationship metrics.
Pro Tip: Assign a named owner to each KPI — a specific manager or team lead who is accountable for the number and has the authority to make the operational changes that move it. Metrics without owners become reports nobody reads.
What measurement mistakes do retail teams make most often?
The most common CX measurement failures are not technical — they are structural. Here is what to watch for and how to fix each one:
- Tracking too many disconnected scores. A 20-metric dashboard with no hierarchy produces analysis paralysis. Fix: apply the three-question framework above and cut any metric that fails question three.
- Treating NPS as the only proof of CX value. NPS is a useful benchmark, but it is a lagging indicator with limited diagnostic power on its own. Medallia recommends pairing NPS with operational KPIs and text analytics to identify specific drivers and link CX to financial outcomes.
- Survey bias and low response rates. A 5% survey response rate from your most loyal customers is not representative. Fix: use in-the-moment feedback tools (kiosks, digital receipts, SMS) to capture a broader, less self-selected sample.
- Ignoring behavioral signals in favor of survey scores. A perception gap documented in Medallia’s 2026 State of CX analysis found that many CX practitioners said experiences were improving while only a small fraction of consumers agreed. Surveys alone will not catch that gap. Add behavioral data.
- Not closing the loop to frontline teams. Insight that stays in a corporate dashboard does not change store behavior. Fix: build a weekly one-page store-level report that shows each manager their three key metrics, the trend, and one recommended action.
Governance basics: Assign a metric owner, set an SLA for distributing insights (weekly for operational metrics, monthly for strategic ones), and give store managers access to action-oriented dashboards rather than raw data exports.
What does recent industry data say about U.S. retail CX performance?
The industry benchmarks paint a clear picture: most retailers have significant room to improve, and the gap between top performers and the average is widening.
Forrester’s analysis placed the average retail Total Experience Score at 59.1 out of 100 in its most recent assessment, with improvement concentrated among brands that invested in product fundamentals and employee experience. Forrester’s updated model now incorporates employee experience (EX) as a direct input to CX delivery — a recognition that frontline staff quality is not a soft variable but a measurable performance driver.
HappyOrNot’s Q2 2026 Retail CX Pulse, drawn from 18.7 million in-store feedback responses, introduced the Store Execution Pressure Map — a tool that reveals when operational pressure (understaffing, replenishment gaps, checkout congestion) is building before satisfaction scores visibly decline. That kind of leading indicator is what separates proactive CX management from reactive damage control.

The 2025 MDPI study (n=359, PLS-SEM methodology) confirmed significant positive paths in the cascade from CES through experience quality, CSAT, and ultimately to customer loyalty intent and NPS. The sample size limits generalizability, but the directional finding is consistent with broader industry evidence: effort reduction is the highest-leverage upstream investment a retailer can make.
The practitioner-consumer gap in that last row is the most actionable finding in the table. If your measurement program relies primarily on internal surveys and practitioner assessments, you are likely overestimating your CX quality. Adding behavioral signals and third-party benchmarks closes that gap.
How can a managed CX partner help retail teams act on metrics?
Most retail organizations can collect data. Fewer have the internal capacity to turn that data into consistent operational action at scale — especially across multiple stores, channels, or geographies. That is where a managed CX partner adds measurable value.
A partner like Altiamcx brings several capabilities that are difficult to build in-house quickly:
- Nearshore managed teams with bilingual agents who handle customer care, technical support, and back-office operations across channels, reducing the internal headcount burden while maintaining service quality.
- Metrics-to-action playbooks that translate CX signal data into specific frontline behaviors — not just reports, but prescribed responses tied to threshold triggers.
- Frontline enablement through training, quality monitoring, and performance coaching aligned to the metrics that matter most for your store type and business model.
- Scalable team deployment that lets retailers expand or contract service capacity in response to seasonal demand without the fixed-cost overhead of permanent hires.
When does outsourcing make sense? Consider a managed partner when:
- Your internal team lacks the analytics or integration capability to connect survey data to transaction records.
- You need to stand up measurement and action programs faster than internal hiring timelines allow.
- You are expanding into new channels or geographies where you do not yet have established CX infrastructure.
- Frontline execution is inconsistent across locations and you need a structured quality framework applied at scale.
A practical example: a mid-sized specialty retailer with 40 locations identified through CSAT and text analytics that post-purchase support contacts were driving a disproportionate share of detractor scores. By deploying a nearshore managed team to handle post-purchase inquiries with a defined resolution SLA, the retailer reduced average resolution time and saw CSAT for that touchpoint recover within eight weeks. The client retention strategies that followed were built directly on the metric improvements that engagement produced.
A practitioner’s perspective on building a measurement program that actually works
Most retail measurement programs fail not because the metrics are wrong, but because the program is designed for reporting rather than action. Here are three operational tests to run in the next 30 days:
- The frontline test: Print your top three CX metrics and show them to five store associates. If they cannot explain what each metric means or how their daily behavior affects it, your program is not operationalized — it is a corporate exercise.
- The decision test: For each metric on your dashboard, identify the last time it triggered a specific operational change. If you cannot name one in the past 90 days, that metric is decorative.
- The cascade test: Pick your lowest-performing CSAT driver from text analytics and trace it back to a specific process, system, or staffing decision. If you cannot draw that line, you are measuring outcomes without understanding causes.
Micro-checklist for validating that a metric is worth keeping:
- [ ] It is tied to a specific customer journey stage.
- [ ] A named team or manager owns it.
- [ ] It has a defined threshold that triggers a review or action.
- [ ] It connects to at least one behavioral or financial outcome metric.
- [ ] It has been reviewed and acted on in the last 60 days.
If a metric fails more than two of those checks, retire it or redesign it before adding anything new to your scorecard.
Altiamcx turns retail CX data into measurable business outcomes
Retail managers who have the metrics but lack the execution capacity to act on them consistently are leaving revenue on the table. Altiamcx delivers nearshore managed CX teams, performance frameworks, and frontline enablement programs built specifically for retail organizations that need to move from insight to outcome faster than internal hiring allows.

The concrete advantage: Altiamcx clients get bilingual, culturally aligned agents deployed against their highest-friction touchpoints, with measurement frameworks that tie every service interaction back to conversion, retention, and resolution metrics. No long ramp time, no fixed overhead for seasonal fluctuations, and no gap between the metrics you track and the operational changes that move them.
See how Altiamcx improved productivity by 89% for a software platform that migrated its technical support operations. If your retail CX program needs faster execution, request a capability assessment to identify where a managed team can close the gap.
Sources
- Retail’s incremental total experience shift; select brands see significant improvement — Forrester (blog)
- Interrelations among CES, CX, CSAT, CLI, and NPS in online retail — MDPI (2025)
- A Smarter Approach to Measuring Customer Experience — MIT Sloan Management Review
- The 6 CX Metrics in Retail That Matter | TruRating
- Retail CX Pulse Q2 2026 | Retail customer experience benchmark — HappyOrNot