
Retail customer lifetime value (CLV) is the projected profit a retailer expects from an average customer over the full course of their relationship. That single number reframes every major commercial decision you make, from how much to spend acquiring a new shopper to which loyalty investments actually pay off. When CLV is on your dashboard, you stop optimizing for the transaction and start building for the relationship.
Pro Tip: Of all the levers available to raise CLV, extending average customer lifespan is typically the most accessible. Reducing churn by even a small margin compounds across your entire customer base faster than raising order values or purchase frequency alone.
Key Takeaways
Retail CLV is the profit a business expects from an average customer over their full relationship, and it is the most reliable metric for aligning acquisition spend, retention investment, and operational priorities.
| Point | Details |
|---|---|
| CLV definition | Profit CLV = AOV × Purchase Frequency × Lifespan × Contribution Margin — always use profit, not revenue, for CAC decisions. |
| LTV:CAC benchmark | A 3:1 ratio is a common rule of thumb; below 2:1 signals unsustainable acquisition spend relative to customer value. |
| Top CLV lever | Extending customer lifespan through operational CX improvements compounds faster than raising AOV or frequency alone. |
| Model selection | Start with cohort analysis; invest in predictive modeling only when you have multi-year transaction data and systematic A/B testing in place. |
| Altiamcx | Altiamcx provides nearshore CX and operations support that directly reduces churn-driving friction, connecting daily service execution to measurable CLV improvement. |
Table of Contents
- What is retail customer lifetime value, and what drives it?
- Why CLV should sit at the center of your retail strategy
- How CLV relates to LTV, CAC, churn, and other metrics you’re already tracking
- How to calculate CLV: a step-by-step worked example
- Which CLV model is right for your retail business?
- What data do you need, and how do you prepare it?
- How to raise CLV: the levers that actually move the number
- How operations and CX directly move the CLV needle
- Common pitfalls that make CLV misleading
- Tools, templates, and a 30-day starter plan
- The CLV work that actually gets done
- Altiamcx helps you turn CLV insight into operational results
- Sources
What is retail customer lifetime value, and what drives it?
CLV is built from four components, and understanding each one separately is what lets you move the number deliberately.
- Average order value (AOV): The mean revenue per transaction. For a skincare brand, the average order value can be typical for that market.
- Purchase frequency: How many times a customer buys within a defined period, typically a year. A loyal skincare customer might purchase multiple times annually.
- Customer lifespan: The average number of years a customer stays active before churning. An average customer lifespan of a few years is common in specialty retail.
- Contribution margin: The percentage of revenue left after variable costs (cost of goods, fulfillment, payment processing). If your margin is 40%, only that portion of revenue is available to cover acquisition costs and generate profit.
The distinction between revenue-based CLV and profit-based CLV matters enormously for acquisition decisions. Revenue CLV ($65 × 4 × 3 = $780) tells you how much a customer spends. Profit CLV ($780 × 40% = $312) tells you how much of that spending you actually keep. Using revenue CLV to set your customer acquisition cost (CAC) ceiling is one of the most expensive mistakes a retail team can make, because it inflates what you think you can afford to spend.
Why CLV should sit at the center of your retail strategy
Most retailers track daily sales, conversion rates, and return on ad spend. Those metrics tell you what happened yesterday. CLV tells you whether yesterday’s customers are worth the investment you made to acquire them.
The strategic uses are concrete:
- CAC allocation: CLV sets the ceiling on what you can rationally spend to acquire a customer in a given segment. A customer with a $312 profit CLV can support a higher CAC than one worth $90.
- Loyalty program budgeting: When you know a loyalty member’s CLV is 2× that of a non-member, the program’s cost justifies itself. Without CLV, you’re guessing.
- Segment prioritization: Not all customers are equal. CLV analysis surfaces which acquisition channels, geographies, or product categories produce your most valuable long-term buyers.
- Revenue forecasting: Multiply average CLV by projected new customer volume and you have a defensible long-term revenue model, not just a quarterly sales target.
A note on the LTV:CAC ratio. Many direct-to-consumer and retail brands use a 3:1 LTV:CAC ratio as a rule of thumb: for every dollar spent acquiring a customer, you should expect three dollars in lifetime profit. That benchmark is useful as a sanity check, but treat it as a starting point rather than a universal law. Category margins, payback period requirements, and growth stage all shift what a healthy ratio looks like for your business.
Research published in the Journal of Service Research confirms that perceived consumer value is multidimensional, spanning economic, functional, emotional, and symbolic dimensions. Experiential and emotional drivers often outweigh price in shaping long-term loyalty, which means non-price operational levers, like service quality and fulfillment reliability, can move CLV more than a discount ever will.
How CLV relates to LTV, CAC, churn, and other metrics you’re already tracking
The terminology around customer value metrics is genuinely confusing, and the confusion has real consequences for decisions.
CLV vs. LTV vs. CLTV: These three terms are used interchangeably in most retail contexts. The meaningful distinction is not the label but whether the figure is revenue-based or profit-based. Always clarify which version you’re looking at before comparing numbers across teams or vendors.
CLV vs. CAC: CLV is the output; CAC is the input. Together they form your unit economics. A CLV of $300 and a CAC of $100 gives you a 3:1 ratio and a viable business. A CLV of $300 and a CAC of $250 means you’re acquiring customers at a pace that will eventually erode margins.
CLV vs. churn rate: Churn is the rate at which customers stop buying. It directly determines customer lifespan, which is one of the three inputs to the basic CLV formula. A 5% annual churn rate implies an average lifespan of 20 years; a 33% churn rate implies roughly 3 years. Small improvements in churn produce outsized CLV gains.
CLV vs. repeat purchase rate: Repeat rate is a leading indicator of CLV. It’s easier to measure in real time and useful for early-warning signals. If repeat rate drops before CLV visibly declines, you have a window to intervene.
When to use which metric: Monitor repeat rate and churn for retention decisions. Use CLV for acquisition budget setting and program ROI. Compare CLV to CAC when evaluating channel efficiency. Track ARPU (average revenue per user) for product and pricing decisions, but don’t confuse it with CLV, which accounts for time.
How to calculate CLV: a step-by-step worked example
The formulas
The standard retail formula, as defined by Shopify’s CLV guide, is:
CLV = AOV × Purchase Frequency × Average Customer Lifespan
To convert that to a profit figure:
Profit CLV = CLV × Contribution Margin
For a more finance-grade approach that accounts for the time value of money, APQC’s retail benchmarking framework uses:
CLV = Margin × (Retention Rate ÷ ((1 + Discount Rate) − Retention Rate))
This version is appropriate when you’re presenting CLV to finance teams or making long-horizon investment decisions.
Step-by-step calculation
- Pull your AOV. Divide total revenue by total orders over a 12-month period. Exclude refunded orders.
- Calculate purchase frequency. Divide total orders by the number of unique customers in the same period.
- Estimate average customer lifespan. Use cohort data: track when customers made their first purchase and when they last purchased. A common shortcut is 1 ÷ annual churn rate.
- Apply contribution margin. Use your actual blended margin after COGS, fulfillment, and payment processing, not gross margin.
- Compute revenue CLV, then profit CLV.
- Divide profit CLV by CAC to get your LTV:CAC ratio.
Worked example: a specialty coffee retailer
- AOV: $48
- Purchase frequency: multiple orders per year
- Average customer lifespan: several years
- Contribution margin: a typical percentage after variable costs
Revenue CLV = $48 × 6 × 2.5 = $720
Profit CLV = $720 × 0.38 = $273.60
LTV:CAC ratio (assuming a $90 CAC) = $273.60 ÷ $90 = 3.04:1
That ratio sits right at the 3:1 benchmark, meaning the business is acquiring customers at a sustainable cost. If CAC climbed to $140, the ratio would drop to 1.95:1, signaling that acquisition spend needs to be cut or CLV needs to improve.
Spreadsheet field list
Build your CLV tracker with these columns: Customer_ID | First_Order_Date | Last_Order_Date | Total_Orders | Total_Revenue | Refunds | Net_Revenue | COGS | Contribution_Margin | Cohort_Month | Channel_Source
Which CLV model is right for your retail business?
| Model | Data needed | Complexity | Predictive power | Best for | Common pitfall |
|---|---|---|---|---|---|
| Simple historical | Order history, 12+ months | Low | None (backward-looking) | Early-stage retailers, baseline benchmarking | Ignores future behavior changes |
| Gross-margin CLV | Order history + COGS | Low | None | CAC decisions requiring profitability focus | Margin data often inconsistent across SKUs |
| Cohort analysis | Customer-level order history by acquisition month | Medium | Moderate | Measuring retention trends, program ROI | Cohort drift if acquisition mix changes |
| RFM segmentation | Recency, frequency, monetary data | Medium | Moderate | Segment prioritization, targeted campaigns | Doesn’t project future value directly |
| Predictive / ML | Multi-year transaction history, behavioral signals | High | High | Large retailers running systematic A/B tests | Requires clean data and model maintenance |
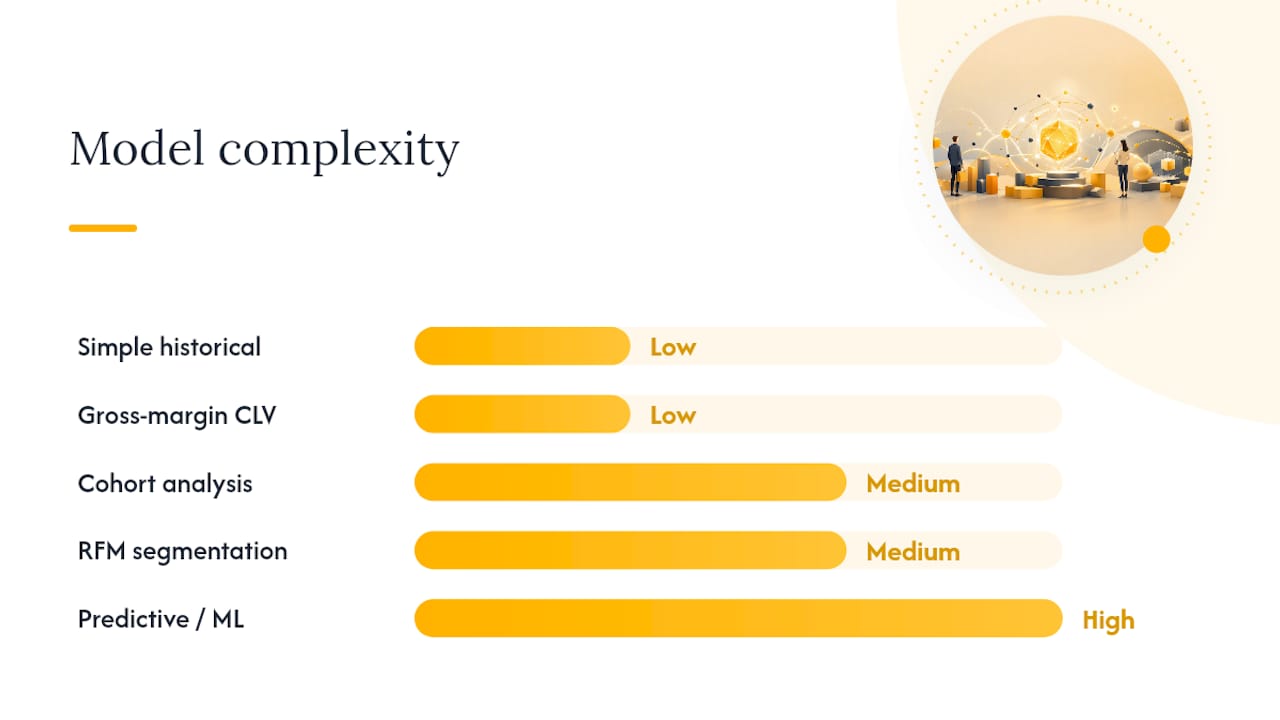
Predictive CLV models deliver the most value when retailers have multiple years of customer-level transaction history and are running systematic experiments that feed supervised models. Without that foundation, a well-maintained cohort analysis or RFM model will serve most decisions just as well and with far less overhead.
Pro Tip: Start with cohort analysis before investing in predictive modeling. Cohorts reveal whether your CLV is improving or declining over time, and that directional signal is what most retail teams actually need to make better decisions. Predictive models answer “how much will this specific customer spend?” — a question that only matters once you’ve already answered “are our customers getting more or less valuable over time?”
What data do you need, and how do you prepare it?
Reliable CLV starts with clean, complete transaction data. Here’s what to gather and how to validate it before running any calculation.
Required data fields
| Field | Source | Notes |
|---|---|---|
| Customer ID | POS / e-commerce platform | Must be consistent across channels |
| Order date | Transaction log | Use order completion date, not payment date |
| Order value (gross) | Transaction log | Pre-discount revenue |
| Refunds / returns | Returns system | Subtract from gross to get net revenue |
| COGS / cost of sale | ERP or accounting system | SKU-level preferred; blended acceptable |
| Marketing source / channel | CRM or UTM data | Needed for channel-level CLV comparison |
| Cohort month | Derived from first order date | Group customers by acquisition month |
Practical preparation steps
Before you trust any CLV output, run these checks:
- Deduplicate customer records. Guest checkouts, multiple email addresses, and in-store vs. online accounts frequently create phantom customers that inflate unique-customer counts and deflate per-customer metrics.
- Define your cohort window. A 12-month window is standard for annual purchase frequency. Use 24 months if your category has long repurchase cycles (furniture, appliances).
- Handle returns consistently. Decide upfront whether to net returns against the original order or exclude the order entirely. Either approach works; inconsistency doesn’t.
- Exclude outliers. One-time bulk buyers (corporate gifting, resellers) skew AOV and frequency. Flag and segment them separately.
- Set a minimum data quality gate. Don’t compute CLV from fewer than 12 months of data or fewer than 500 unique customers. Below those thresholds, use repeat purchase rate as a proxy instead.
Early-stage sellers who haven’t yet accumulated enough transaction history can start with repeat purchase rates and average retention periods as leading indicators, building toward a full CLV model as data matures.
How to raise CLV: the levers that actually move the number
Improving CLV comes down to four variables: extend lifespan, raise purchase frequency, increase AOV, or improve margin. The tactics below are ranked roughly by effort-to-impact ratio, with the highest-impact, lower-effort levers first.
- Extend customer lifespan through retention programs. Targeted win-back campaigns at identified churn points, proactive outreach after a missed repurchase window, and subscription or auto-replenishment models all extend the active customer period. According to Wharton Executive Education practitioner research, extending average customer lifespan is often the most cost-effective CLV lever because it compounds across the entire base without requiring price changes. Involve your CX and operations teams, not just marketing.
- Loyalty programs tied to purchase frequency. Points-based programs work best when redemption is easy and rewards are relevant. The key metric to watch is whether loyalty members’ purchase frequency actually exceeds non-members’ by enough to justify the program cost. If it doesn’t, the program is a discount mechanism, not a CLV driver.
- Post-purchase communication. A well-timed follow-up email after a first purchase, a product usage guide, or a personalized reorder reminder costs almost nothing and measurably improves second-purchase rates. This is where high-touch customer service creates a compounding advantage.
- Personalization at scale. Segment customers by RFM score and tailor offers accordingly. High-frequency, high-value customers respond to early access and exclusivity. Lapsed customers respond to reactivation incentives. Treating both groups identically wastes budget.
- AOV tactics: bundles, cross-sell, and minimum thresholds. Free shipping thresholds, product bundles, and “frequently bought together” recommendations raise AOV without discounting. Involve merchandising to identify natural product affinities from purchase data.
- Margin improvement. Shifting customers toward higher-margin SKUs, reducing return rates through better product descriptions and sizing guides, and negotiating better fulfillment rates all improve profit CLV without touching revenue CLV at all.
For measuring impact, compare cohort CLV before and after each tactic with at least a 90-day lag. Attribution is imperfect, but cohort-level trends are directionally reliable.
How operations and CX directly move the CLV needle
CLV is often treated as a marketing metric. It shouldn’t be. The decisions made in your contact center, fulfillment operation, and returns process have a direct, measurable effect on customer lifespan, which is the single largest driver of CLV for most retailers.
The operational levers that matter most:
- Fulfillment speed and accuracy. Late or incorrect orders are among the top drivers of first-to-second purchase drop-off. A customer who receives the wrong item and has to contact support is far more likely to churn than one whose order arrived correctly and on time.
- Return policy design. A frictionless return experience converts a potential churn event into a retention opportunity. Customers who successfully complete a return and receive a prompt refund often show higher repeat purchase rates than customers who never had an issue at all.
- Contact center resolution time. First-contact resolution (FCR) is the contact center KPI most directly linked to retention. Every escalation, every callback, every unresolved issue is a churn risk. CX metrics for retail performance should include FCR alongside NPS and CSAT.
- Post-purchase communication quality. Proactive shipping updates, clear return instructions, and personalized follow-ups reduce inbound contact volume and improve satisfaction simultaneously.
Research confirms that perceived value is multidimensional, with experiential and emotional dimensions often outweighing price in driving long-term loyalty. That finding has a direct operational implication: a customer who feels well-served will stay longer than a customer who received a discount.
A brief scenario. A mid-size apparel retailer identifies that customers who contact support about a sizing issue and don’t get a resolution within 24 hours churn at 2× the rate of customers who receive same-day resolution. By staffing a dedicated sizing support queue and reducing resolution time from 36 hours to under 8 hours, the team extends average customer lifespan by 0.4 years. On a $250 profit CLV base, that single operational change adds roughly $33 in CLV per affected customer. Across 10,000 affected customers annually, the math is significant.
KPIs to monitor that link operations to CLV:
- First-contact resolution rate (an important operational KPI for retail categories)
- Repeat purchase rate by cohort (month-over-month trend)
- Return-to-repurchase conversion rate
- NPS and CSAT segmented by issue type
- Average resolution time vs. 30-day repurchase rate
Retail customer care strategies that connect these operational KPIs to CLV outcomes give operations leaders a clear line of sight from daily execution to long-term profitability.
Common pitfalls that make CLV misleading
CLV is only as reliable as the decisions and data behind it. These are the traps that most commonly distort the number.
- Using revenue CLV instead of profit CLV for acquisition decisions. Treating LTV as revenue rather than profit is the most expensive mistake in retail unit economics. It inflates your apparent CAC ceiling and leads to overspending on acquisition. Always apply contribution margin before comparing CLV to CAC.
- Averaging across segments that behave differently. A single blended CLV hides the fact that your top 20% of customers may have a CLV five times higher than the bottom 40%. Segment before you act.
- Ignoring cohort drift. If your acquisition mix shifts (new channels, new geographies, promotional spikes), your newer cohorts may behave very differently from older ones. A rising average CLV can mask deteriorating cohort quality if newer customers are being compared to a historical baseline that no longer applies.
- Seasonality and promotion bias. Customers acquired during a major sale event often have lower repeat purchase rates and lower AOV than organically acquired customers. Mixing them into your baseline CLV inflates frequency and deflates lifespan.
- Poor data quality. Duplicate customer records, inconsistent return handling, and missing COGS data all introduce errors that compound through the formula. Run data quality checks before every CLV refresh.
- Applying CLV too early. For retailers with fewer than 12 months of transaction data or fewer than 500 unique customers, CLV calculations are statistically unreliable. Use repeat purchase rate and average retention period as proxies until the data matures.
- When CLV is the wrong lens entirely. One-off purchase categories (wedding dresses, moving supplies) have near-zero repeat rates by design. For these businesses, CLV is less useful than margin-per-transaction and referral rate.
Tools, templates, and a 30-day starter plan
You don’t need enterprise software to start measuring CLV. The right tool depends on your data maturity and team capacity.

| Tool category | Examples | Best for |
|---|---|---|
| Spreadsheet / BI | Excel, Google Sheets, Looker Studio | Early-stage CLV, cohort tables, scenario modeling |
| E-commerce analytics | Platform-native analytics (Shopify Analytics, etc.) | Quick CLV estimates, repeat purchase tracking |
| Customer data platform (CDP) | Segment, Bloomreach | Unified customer profiles, cross-channel CLV |
| Advanced BI / ML | BigQuery + dbt, Python notebooks | Predictive CLV, large-scale cohort analysis |
| Retention marketing platforms | Klaviyo, Attentive | CLV-triggered campaigns, segment-based automation |
30-day starter checklist
Week 1: Data gathering
- Export 12–24 months of transaction data with all required fields
- Deduplicate customer records and reconcile multi-channel IDs
- Pull COGS or blended contribution margin from finance
Week 2: Compute cohorts
- Group customers by acquisition month
- Calculate AOV, purchase frequency, and lifespan per cohort
- Compute revenue CLV and profit CLV; compare to current CAC
Week 3: Pilot one retention tactic
- Identify your highest-churn cohort or lifecycle stage
- Launch one targeted intervention: a win-back email sequence, a post-purchase follow-up, or a loyalty enrollment prompt
- Set a 30-day repeat purchase rate target for the pilot group
Week 4: Measure and share
- Compare pilot group repeat rate to control group
- Update your CLV model with any new data
- Present CLV vs. CAC findings to finance and marketing leadership with a recommended budget adjustment
For your spreadsheet template, include columns for each input variable, a formula row that auto-calculates revenue and profit CLV, a cohort comparison tab, and a scenario model that shows CLV sensitivity to a 10% change in each input. Share it with finance before presenting to leadership so the margin assumptions are validated.
The CLV work that actually gets done
Here’s the honest practitioner view: most retail teams understand CLV conceptually but delay acting on it because the data work feels daunting and the payoff seems distant. That’s the wrong sequencing.
The highest-return starting point is almost always operational, not analytical. Before you build a predictive model or redesign your loyalty program, fix the CX bottleneck that’s causing your best customers to churn after their second purchase. That intervention is faster, cheaper, and more measurable than any modeling exercise. Improving client retention through targeted operational changes consistently outperforms broad acquisition spending when the unit economics are tight.
On the acquisition-versus-retention budget question: most retail organizations over-invest in acquisition and under-invest in retention, partly because acquisition results are visible faster. CLV analysis makes the retention case in financial terms that finance and the board can evaluate directly. That’s its real organizational value. It’s not just a metric; it’s a shared language for prioritizing where the business puts its resources.
One practical note: align your CLV methodology with your finance team before you present it to leadership. If finance uses a different margin definition than your marketing team, the resulting CLV figures will conflict, and the credibility of the analysis suffers. Get that alignment in week one, not week four.
Altiamcx helps you turn CLV insight into operational results
Understanding your CLV is the first step. Executing the operational changes that move it is where most retail teams hit capacity constraints.
Altiamcx delivers nearshore customer care, technical support, and back-office operations specifically designed to reduce the friction points that drive churn. Where a slow contact center resolution or a difficult returns process is costing you customer lifespan, Altiamcx provides trained, bilingual agents and measurable performance frameworks that connect daily CX execution to your retention KPIs. The result is a retail CX operation that doesn’t just handle volume but actively protects the customer relationships your CLV depends on. To see how Altiamcx has delivered measurable operational improvements for retail clients, review the productivity case study and request a conversation about your specific retention goals.
Sources
The sources below underpin the formulas, frameworks, and operational guidance in this guide. Each one serves a distinct purpose depending on where you are in your CLV journey.
- Customer lifetime value (CLV) for your retail operation - APQC
- Customer Perceived Value: A Comprehensive Meta-analysis (Journal of Service Research / Wiley)