
Ecommerce returns management is the end-to-end operational system that converts a customer’s return request into a tracked business outcome, whether that’s a refund, exchange, restock, refurbish, or disposal. It spans every touchpoint from the moment a customer initiates a return through final financial resolution, and it directly affects your margin, conversion rate, and customer lifetime value. Handled well, returns become a retention tool rather than a cost center. Handled poorly, they erode working capital and push customers to competitors.
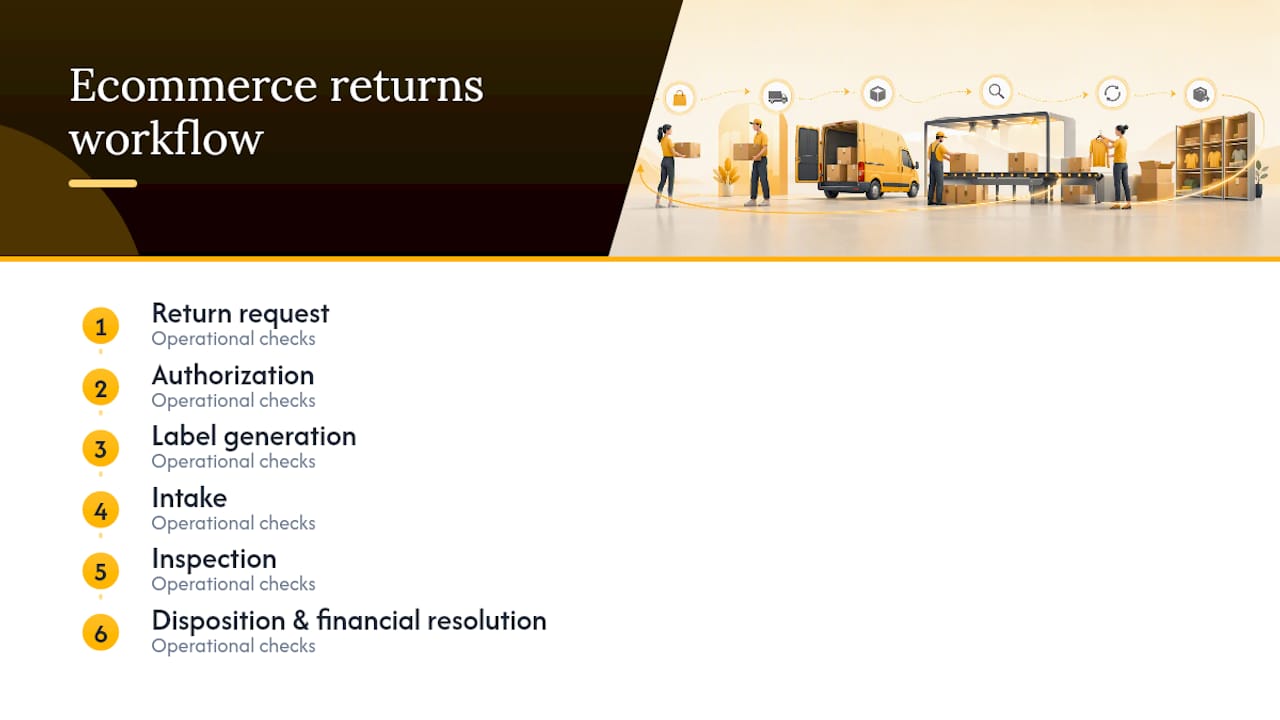
The canonical process runs through six stages:
- Initiation/RMA validation: Customer submits a return request; system validates eligibility against policy rules.
- Label generation and shipping: Approved return triggers a prepaid or customer-paid label; item ships back.
- Receiving and intake: Warehouse logs the inbound return against the original order record.
- Inspection and condition grading: Staff assess item condition and assign a disposition grade.
- Disposition routing: Item is restocked, refurbished, liquidated, donated, or written off based on grade.
- Customer resolution: Refund, exchange, or store credit is issued and confirmed.
E-commerce returns, return rates vary significantly by category, with apparel and footwear consistently posting the highest volumes among U.S. retailers. That variance is exactly why operations managers need a structured system rather than ad hoc decisions at every stage.
Key Takeaways
Ecommerce returns management is a six-stage operational system that protects margin, drives repurchase, and connects warehouse execution to financial outcomes when each stage is owned, measured, and continuously improved.
| Point | Details |
|---|---|
| Define scope clearly | Returns management covers policy, authorization, inspection, disposition, and financial resolution — not just shipping. |
| Exchange-first routing | Routing return requests through an exchange offer before a refund converts 30–50% of potential refunds into retained revenue. |
| Policy drives conversion | Nearly half of shoppers check a return policy before purchase; a clear, generous policy is a top-of-funnel conversion lever. |
| KPIs that matter most | Track return rate by SKU, per-return unit cost, recovery rate, time-in-limbo, and customer repurchase rate after a return. |
| Altiamcx for scale | Altiamcx provides nearshore RMA intake, inspection documentation, and returns reporting so operations teams scale without adding fixed overhead. |
Table of Contents
- What does ecommerce returns management actually cover?
- Why customers return goods and what it costs your business
- How the six-stage returns workflow operates
- How to design a return policy that balances conversion and margin
- Which returns management systems should you evaluate?
- How to reduce return volume and improve recovery value
- KPIs and reporting that connect returns to business outcomes
- How to implement returns management at scale: roles, governance, and a 90-day pilot
- A practitioner’s note on returns, CX, and the tradeoffs that actually matter
- Altiamcx scales your returns operations without the overhead
- Sources
What does ecommerce returns management actually cover?
Returns management is broader than most operations teams initially assume. It covers the customer-facing rules (your ecommerce return policy), the authorization workflow, label generation, physical intake, inspection, disposition, and the financial outcomes tied to each return. Every one of those activities touches a different team: CX and support own the customer interaction and RMA authorization; warehouse and fulfillment own receiving, inspection, and disposition; finance owns the refund or credit issuance; and product or quality teams own the data that flows back from inspection results.
Returns management vs. reverse logistics is a distinction worth getting right. Reverse logistics is the physical movement of goods back through the supply chain, including repair, refurbishment, resale, and recycling. Returns management is the broader administrative and financial control layer sitting above it. Think of reverse logistics as a subprocess within returns management, not a synonym for it.
A disciplined returns process keeps tactical returns management (customer authorization, policy enforcement, refunds, and exchanges) separate from strategic reverse logistics (repair, refurbishment, resale, recycling) and assigns clear ownership to each. Without that separation, you get operational friction: warehouse staff making policy calls they shouldn’t be making, and CX agents approving exceptions that warehouse can’t execute.
Activities by team:
- CX/Support: Return request intake, RMA validation, customer communication, refund/exchange authorization.
- Warehouse/Fulfillment: Physical receiving, inspection, grading, disposition execution, inventory update.
- Finance: Refund processing, chargeback management, recovery accounting, P&L impact reporting.
- Product/Quality: Defect trend analysis, SKU-level return rate monitoring, supplier feedback loops.
A connected record that ties the return to the original order, customer, SKU, inspection result, and financial resolution is what makes this cross-functional system work. Disconnected records cause inventory discrepancies, delayed refunds, and the kind of visibility loss that makes it impossible to act on return data.
Why customers return goods and what it costs your business
Return reasons cluster into five categories: fit or size issues, product damage or defect, wrong item shipped, buyer’s remorse or changed mind, and deliberate return fraud. The distribution shifts by category. Apparel and footwear returns are dominated by fit issues, often accounting for the majority of volume. Electronics returns skew toward defect claims and “not as described” complaints, which carry higher fraud risk.
The per-return cost is rarely just the shipping label. A full cost breakdown typically includes:
- Outbound and return shipping: Both legs if you offer free returns.
- Processing labor: Receiving, inspection, repackaging, and restocking time.
- Restocking or liquidation losses: Markdown required to move B- or C-grade inventory.
- Chargeback fees: When customers dispute rather than request a return, fees compound the loss.
- Opportunity cost: Inventory tied up in returns limbo isn’t available for resale.
The conversion and LTV implications are where returns management becomes a strategic priority rather than a back-office function. Research cited by Getfairview indicates that free returns can increase conversion by roughly 20–35% in categories where fit or feel is uncertain, such as apparel and footwear.
Nearly half of shoppers check a retailer’s return policy before making a purchase. A restrictive or unclear policy doesn’t just affect post-purchase experience; it suppresses conversion at the top of the funnel. That’s why the importance of returns management extends well beyond the warehouse.
How the six-stage returns workflow operates
A repeatable, stage-by-stage workflow is what separates operations teams that control their return costs from those that absorb them. Here is the full playbook, with operational checks at each stage.
Stage 1: Return request and RMA validation
The customer submits a return request through your portal or support channel. The system (or agent) validates eligibility: Is the item within the return window? Is the SKU eligible? Does the order status confirm delivery? Is there a pattern of prior returns from this customer that triggers fraud screening?
Operational checks:
- Confirm order ID, delivery date, and return window compliance.
- Validate SKU against excluded-item list.
- Apply automated fraud scoring before issuing RMA.
- Capture return reason code at initiation (fit, defect, wrong item, changed mind, other).
- Route exchange-eligible returns to an exchange offer before issuing a refund RMA.
Stage 2: Label generation and shipping
Once the RMA is approved, the system generates a return label. Carrier selection at this stage affects both cost and speed of recovery.
Operational checks:
- Select carrier based on package weight, origin zip, and cost rules (not default carrier every time).
- Embed the RMA number in the label barcode for automatic intake matching.
- Set label expiration to enforce the return window (typically 14–21 days from issue).
- Log label generation event against the return record for tracking.
Stage 3: Receiving and intake
The item arrives at the warehouse. This is where the return record gets its first physical confirmation.
Operational checks:
- Scan the RMA barcode on arrival to auto-match to the open return record.
- Log receipt timestamp for SLA tracking (time-in-returns-limbo clock starts here).
- Flag any packages arriving without a valid RMA for exception handling.
- Separate high-value items for priority inspection.
Stage 4: Inspection and condition grading
Inspection is where disposition decisions get made. Standardizing grades prevents subjective calls that leak margin.

| Grade | Condition | Default Disposition |
|---|---|---|
| A | Unopened or like-new, original packaging intact | Restock at full price |
| B | Opened, functional, minor cosmetic wear | Repackage and restock at slight markdown |
| C | Functional but significant wear or missing parts | Refurbish or liquidate |
| Write-off | Damaged, non-functional, or fraudulent | Dispose or recycle |
Operational checks:
- Use a standardized inspection checklist per product category (not a single generic form).
- Photograph defects for any item graded C or Write-off.
- Record inspection result against the return record before disposition.
- Flag defect patterns (same SKU, same defect type) for product team review.
Pro Tip: Assign disposition codes at inspection, not after. Waiting until the item reaches a secondary review step adds days to the cycle and keeps inventory off your available-to-sell count. A real-time disposition code entered at the inspection station updates inventory planning immediately.
Stage 5: Disposition routing
Standardizing disposition codes prevents margin leakage by making high-value returned inventory immediately visible to warehouse, inventory planning, and finance teams. The four primary routes are restock, refurbish, liquidate, and donate or recycle. Each should have a defined threshold: if refurbishment cost exceeds X% of the item’s resale value, route to liquidation instead.

Stage 6: Customer resolution
The final step closes the loop with the customer. Speed here is a retention variable.
Operational checks:
- Issue refund, exchange, or store credit within your stated SLA (24–72 hours of inspection completion is a defensible target).
- Send a confirmation notification with the resolution type and amount.
- Log resolution outcome against the return record for cohort analysis.
- Trigger a post-return satisfaction survey 48–72 hours after resolution.
How to design a return policy that balances conversion and margin
Your ecommerce return policy is both a conversion tool and a margin-protection instrument. The decisions you make at policy design time determine your cost structure for every return that follows.
Decision checklist for policy design:
- Return window: 30 days is the industry standard; 60–90 days is increasingly common among DTC brands competing on experience. Longer windows reduce urgency-driven returns and tend to lower actual return rates because customers have time to reconsider.
- Who pays return shipping: Free returns increase conversion, particularly in apparel and footwear. Charging for return shipping reduces volume but suppresses some legitimate purchases. A middle path: free returns for exchanges, customer-paid for refunds.
- Refund vs. exchange default: Default to offering an exchange before a refund in your portal flow. Exchange-first routing is the highest-leverage margin move available at the policy level.
- Excluded SKUs: Final-sale items, personalized products, digital goods, and hygiene-sensitive categories should be explicitly excluded. List them by category, not just a blanket “some items excluded” clause.
- International returns: State clearly whether international orders are eligible, who pays duties on the return shipment, and whether a different window applies.
- Warranty vs. return: Distinguish between a return (customer changed mind or fit issue) and a warranty claim (defect or malfunction). Different workflows, different cost owners.
Sample policy language (adapt as needed):
Pro Tip: Publish your policy on the product page, not just the footer. Shoppers who see the return policy at the point of decision convert at higher rates. A single line (“Free returns within 30 days”) near the Add to Cart button does more conversion work than a full policy page buried in the site navigation.
The free-returns-as-acquisition-investment framing is worth internalizing. Model it that way in your P&L and the math often changes the decision.
Which returns management systems should you evaluate?
A returns management system (RMS) or returns portal centralizes the functions that would otherwise be handled manually across email, spreadsheets, and disconnected carrier portals. The core capabilities any RMS must deliver include self-serve return initiation, automated policy validation, label generation across multiple carriers, exchange-first flow routing, inspection record keeping, disposition tracking, and analytics by SKU and category.
An RMS that centralizes RMA creation, label generation, inspection records, and disposition routing reduces time-in-returns-limbo and keeps inventory counts accurate in real time. Without that centralization, returns sit in a gray zone where neither the customer nor your warehouse knows the status.
The vendor landscape covers several distinct capability profiles:
-
Shippo is a carrier-agnostic label generation platform. It connects to USPS, UPS, FedEx, and DHL, and it handles return label creation as part of a broader shipping workflow. Best for operations teams that need multi-carrier flexibility and want to manage return labels within the same platform as outbound shipping.
-
Loop Returns is built specifically for exchange-first returns. Its portal flow presents exchange options before a refund path, and it integrates natively with Shopify. Operations teams running high-volume DTC apparel or footwear brands typically see the strongest exchange-conversion lift here.
-
AfterShip covers post-purchase tracking and returns in a single platform. Its returns module handles branded portals, automated notifications, and multi-carrier label generation. Strong fit for operations teams that want unified tracking and returns visibility without managing two separate tools.
-
Returnly focuses on instant exchange: the customer receives a replacement before the original item is returned, which removes the friction of waiting. The tradeoff is inventory risk, so it works best when fraud rates are low and AOV justifies the float.
-
Narvar is oriented toward post-purchase communications and returns experience at scale. It handles return tracking, customer notifications, and drop-off network integrations. Enterprise retailers with complex carrier relationships and high notification volume tend to get the most from it.
Selection checklist for your RMS evaluation:
- Does it integrate natively with your commerce platform (Shopify, Magento, BigCommerce)?
- Is label generation carrier-agnostic, or are you locked to one carrier?
- Does the portal enforce your policy rules at initiation, or can agents override them freely?
- Does it capture inspection results and disposition codes, or only the logistics layer?
- What analytics does it provide at the SKU and category level?
- What is the typical time-to-launch for a business your size?
- Does it include fraud scoring or integrate with a fraud platform like Signifyd?
Pro Tip: Prioritize policy enforcement at the portal level. A self-serve portal that applies your eligibility rules automatically, without agent intervention, is the single most effective way to prevent policy drift and subjective exceptions. Every manual exception is a margin leak and a data gap.
AI-driven product recommendations and fit tools are increasingly relevant here too. AI applications in ecommerce now include return-risk scoring at the SKU level and personalized size guidance that reduces fit-related returns before they happen.
How to reduce return volume and improve recovery value
Prevention and recovery are two separate levers, and most operations teams underinvest in both.
Prevention tactics:
- Add size guides, fit charts, and customer-submitted photos to product pages for apparel and footwear. Fit-related returns are largely preventable with better pre-purchase information.
- Use video for products where static images don’t convey scale, texture, or assembly complexity.
- Display customer reviews that mention fit, size, or quality prominently on the product page.
- Flag high-return SKUs in your product catalog and trigger a content audit when a SKU’s return rate exceeds your category threshold.
Operational tactics:
- Route all return requests through an exchange offer before presenting the refund option. Even a 20% exchange uptake on what would have been refunds materially improves margin.
- Use instant-exchange guardrails: cap the value eligible for instant exchange, require a valid payment method on file, and apply fraud scoring before releasing the replacement order.
- Offer conditional free returns: free for exchanges, paid for cash refunds. This shifts the incentive without eliminating the free-returns conversion benefit.
- Automate fraud screening using return history, order velocity, and address patterns. Customers with a history of returning items in used condition or claiming non-delivery repeatedly are identifiable before you issue the next RMA.
Recovery tactics:
- Grade returned inventory at inspection and route A-grade items back to available-to-sell within 24 hours of receipt. Every day an A-grade item sits in returns processing is a lost sale.
- Set a refurbishment threshold: if the cost to refurbish a C-grade item exceeds a defined percentage of its resale value, route it to liquidation instead. Refurbishing low-value items at high labor cost destroys margin.
- Partner with a recommerce or liquidation platform for B- and C-grade inventory. Selling at 30–50 cents on the dollar through a liquidation channel recovers more value than disposal and removes the inventory from your books faster.
- Donate write-off items to eligible nonprofit partners when disposal is the alternative. Some donation programs generate a tax benefit that partially offsets the write-off.
Pro Tip: *Track recovery rate by disposition code, not just overall.
KPIs and reporting that connect returns to business outcomes
Returns data is only useful if it triggers decisions. The metrics below are the ones that connect returns performance to finance, product, and CX outcomes.
Core KPIs to track:
- Return rate by SKU and category: The primary signal for product quality and content issues. A SKU return rate above your category benchmark should trigger a product QA review.
- Per-return unit cost: Total cost (shipping, labor, disposition loss) divided by return volume. Track this monthly to measure the impact of operational changes.
- Recovery rate: The percentage of returned items that are resold or refurbished at or above a defined margin threshold. Tracks how much value your disposition process recovers.
- Time-in-returns-limbo: Days from warehouse receipt to final resolution. Long cycles tie up working capital and delay customer resolution.
- Exchange uptake rate: The percentage of return requests that convert to an exchange rather than a refund. The most direct measure of your exchange-first routing effectiveness.
- Chargeback rate: Chargebacks that originate from return disputes signal policy gaps or communication failures.
- Customer repurchase rate after a return: The clearest measure of whether your returns experience is a retention tool or a churn driver.
Post-return customer feedback is an underused signal. A structured post-return survey, sent 48–72 hours after resolution, captures sentiment at the moment it’s most actionable and feeds directly into your repurchase rate analysis.
Reporting structure:
- Weekly operational report: Return volume, time-in-limbo, open RMAs by age bucket, exception queue size.
- Monthly P&L impact report: Per-return cost, recovery rate, exchange uptake, chargeback rate, and net returns cost as a percentage of revenue.
- Quarterly SKU-level return rate report: Return rate by SKU against category benchmark, with flagged items for product QA review.
Action triggers:
- SKU return rate exceeds category benchmark by more than 10 percentage points: trigger product content audit and QA review.
- Time-in-limbo exceeds 5 business days on average: trigger warehouse process review.
- Exchange uptake drops below 20%: review portal flow and exchange offer presentation.
- Chargeback rate rises month-over-month: review fraud screening rules and policy communication.
Rolling returns data into cohort LTV analysis is where the strategic picture becomes clear. A customer who had a return resolved within 48 hours and received a proactive notification has a measurably different repurchase rate than one who waited 10 days with no update. That difference belongs in your LTV model, not just your ops report.
How to implement returns management at scale: roles, governance, and a 90-day pilot
Scaling a returns program requires defined ownership, documented SLAs, and a timeboxed pilot that validates the model before you commit to full rollout.
Recommended roles and responsibilities:
- CX/Support: Return request intake, RMA validation, customer communication, escalation handling.
- Operations/Fulfillment: Physical receiving, inspection, grading, disposition execution, inventory updates.
- Finance: Refund processing, recovery accounting, chargeback management, P&L reporting.
- Product/Quality: SKU-level return rate analysis, defect trend reporting, supplier feedback.
- Fraud Prevention: Return fraud screening rules, policy abuse monitoring, RMA exception review.
- 3PL/Partner (if applicable): Physical handling per documented SLAs, inspection reporting, disposition execution.
Governance and SLAs:
- RMA turnaround (request to label issued): 2–4 business hours for automated approvals; 24 hours for manual review.
- Inspection SLA: within 24 hours of warehouse receipt for standard items; 4 hours for high-value items.
- Disposition resolution SLA: within 24 hours of inspection completion.
- Customer resolution SLA: refund or exchange issued within 24–72 hours of inspection.
90-day pilot checklist:
- Days 1–15: Policy and system decisions. Finalize return window, shipping responsibility, exchange-first defaults, and excluded SKUs. Select and configure your RMS. Document inspection grading rubric.
- Days 16–30: Portal implementation and integration. Connect RMS to your commerce platform. Test label generation across carriers. Validate policy rules fire correctly at initiation.
- Days 31–45: Warehouse training. Train receiving and inspection staff on grading rubric and disposition codes. Run parallel processing (manual + system) to validate accuracy.
- Days 46–60: Go-live on pilot SKU set. Launch the portal for a defined category or SKU group. Capture all KPIs from day one.
- Days 61–75: Data review and adjustment. Review time-in-limbo, exchange uptake, recovery rate, and per-return cost against targets. Adjust portal flow, grading rubric, or carrier selection based on findings.
- Days 76–90: Go/no-go decision. If KPIs are within 15% of targets, proceed to full rollout. If not, identify the specific stage causing variance and address before expanding.
Pro Tip: Don’t pilot on your highest-volume category first. Choose a mid-volume category with a known return rate so you have a baseline to measure against. High-volume pilots amplify every process gap before you’ve had time to fix them.
For ecommerce support operations teams building this infrastructure from scratch, the 90-day pilot is also the right window to validate whether your internal headcount can absorb the returns volume or whether you need a staffing model that scales with peak seasons.
A practitioner’s note on returns, CX, and the tradeoffs that actually matter
The debate over free returns vs. margin protection misses the more important question: what happens to the customer after the return is resolved? Most operations teams optimize for cost per return and stop there. The metric that actually predicts whether a return becomes a retention event or a churn event is resolution speed combined with proactive communication.
A customer who receives a return confirmation within 2 hours of submitting a request, a tracking update when the item is received, and a refund notification within 24 hours of inspection has a fundamentally different experience than one who submits a request and hears nothing for a week. The operational cost difference between those two experiences is mostly a process and communication design problem, not a budget problem.
The concrete change that consistently moves the needle: automate the “we received your return” notification at the warehouse intake scan. It costs nothing to configure in most RMS platforms, and it eliminates the single most common post-return support contact (“Did you get my return?”). Fewer inbound contacts means lower support cost and a customer who feels informed rather than ignored.
For measuring sentiment after a return, a single-question post-resolution survey (“How satisfied were you with your return experience?”) sent 48 hours after resolution gives you a clean signal without survey fatigue. Tie that score to repurchase behavior in your CRM and you’ll have the data to make the business case for every process investment that follows.
Altiamcx scales your returns operations without the overhead
Returns management at scale requires consistent staffing across intake, inspection documentation, disposition admin, and customer communication. That’s where the cost and quality gaps appear fastest, particularly during peak seasons when return volume spikes and your core team is already stretched.

Altiamcx delivers nearshore managed support specifically built for ecommerce back-office operations, including RMA intake, returns portal staffing, inspection documentation, disposition record management, and returns reporting. Bilingual agents, off-hours coverage, and a performance framework tied to your KPIs mean you get measurable output, not just headcount. The result: faster resolution cycles, fewer exceptions, and returns data that actually connects to your finance and product teams. If you’re planning a returns pilot or need to scale an existing program, see how Altiamcx improved operational productivity by 89% for a software platform that made a similar move, then reach out to discuss what a managed returns support model looks like for your operation.
Sources
- E-commerce Returns Management: Complete Guide
- Ecommerce Return Policy Best Practices for Retailers
- Ecommerce Return Policy Template: Copy-Ready Language
- E-commerce returns in the United States - Statista