
Customer Effort Score (CES) measures how easy it was for a customer to complete a task — such as making a purchase, processing a return, or resolving a support issue — and it is one of the most direct predictors of repurchase and loyalty available to retail CX teams. A standard CES v2.0 question reads: “How easy was it to resolve your issue today?” rated on a 1–7 scale, where 7 is “extremely easy.” The top-box score, representing customers rating the experience as very easy, is the most actionable number to track.
Three actions you can run with immediately:
- Run a transactional CES survey immediately after support contacts, return flows, and checkout completions — not days later.
- Map your highest-effort touchpoints by sorting CES responses by channel, store, and interaction type to find where friction concentrates.
- Prioritize one A/B fix in the area with the lowest CES: simplify a return form, add a self-service tracking page, or reduce checkout steps.
Key Takeaways
Reducing customer effort at the highest-volume retail touchpoints — checkout, returns, and post-purchase support — is the most direct path to higher repurchase rates and lower service costs.
| Point | Details |
|---|---|
| CES definition | CES measures how easy a specific interaction was, on a 1–7 scale, using top-box % as the primary operational metric. |
| Highest-effort touchpoints | Returns, checkout, and post-purchase support generate the most friction and should be instrumented first. |
| Benchmark context | Top-box % for e-commerce checkout typically falls in the — range. Returns run structurally lower at —. |
| Program discipline | Segment CES by channel, category, and customer cohort; act on structural patterns, not week-to-week noise. |
| Altiamcx | Altiamcx provides nearshore staffing, bilingual agents, and operational governance to execute CES-driven remediation at scale. |
Table of Contents
- What is customer effort score in retail, and why does it predict loyalty?
- How does CES compare to CSAT and NPS for retail teams?
- How to measure CES in retail: question wording, timing, and calculation
- What are good CES benchmarks for retail?
- Which retail touchpoints create the most customer effort?
- Prioritized strategies to reduce customer effort in retail
- Best practices for running a CES program in retail
- Common mistakes retail teams make with CES programs
- Three retail-ready CES survey templates
- Which metrics should you track alongside CES?
- When should you engage a managed CX partner for your CES program?
- A practitioner’s perspective on CES in retail
- Altiamcx scales CES-driven fixes for retail teams
- Sources
What is customer effort score in retail, and why does it predict loyalty?
CES is a single-item transactional metric that captures how much work a customer had to put in to get something done. Unlike satisfaction scores that measure emotional reaction or advocacy scores that gauge long-term brand sentiment, CES isolates the friction in a specific interaction. Qualtrics describes CES as purpose-built for post-interaction measurement, with a direct correlation to churn risk and repurchase probability.
The concept gained traction after a 2010 Harvard Business Review article by Matthew Dixon and colleagues argued that reducing customer effort is a more reliable path to loyalty than attempting to delight customers. The core finding: customers who experience low effort are far more likely to repurchase and far less likely to spread negative word-of-mouth. Trying to exceed expectations, the research showed, rarely produces a proportional loyalty return.
Gartner’s effortless experience research reinforces this: small reductions in customer effort produce disproportionate gains in repurchase rates and measurable reductions in service cost. For retail, where margins are tight and repeat purchase is the revenue engine, that asymmetry matters. A customer who struggled to return a product is not just unlikely to buy again — they are likely to tell others about it.
How does CES compare to CSAT and NPS for retail teams?
Each of the three core CX metrics answers a different question, and retail teams get the most value by using all three in the right context.
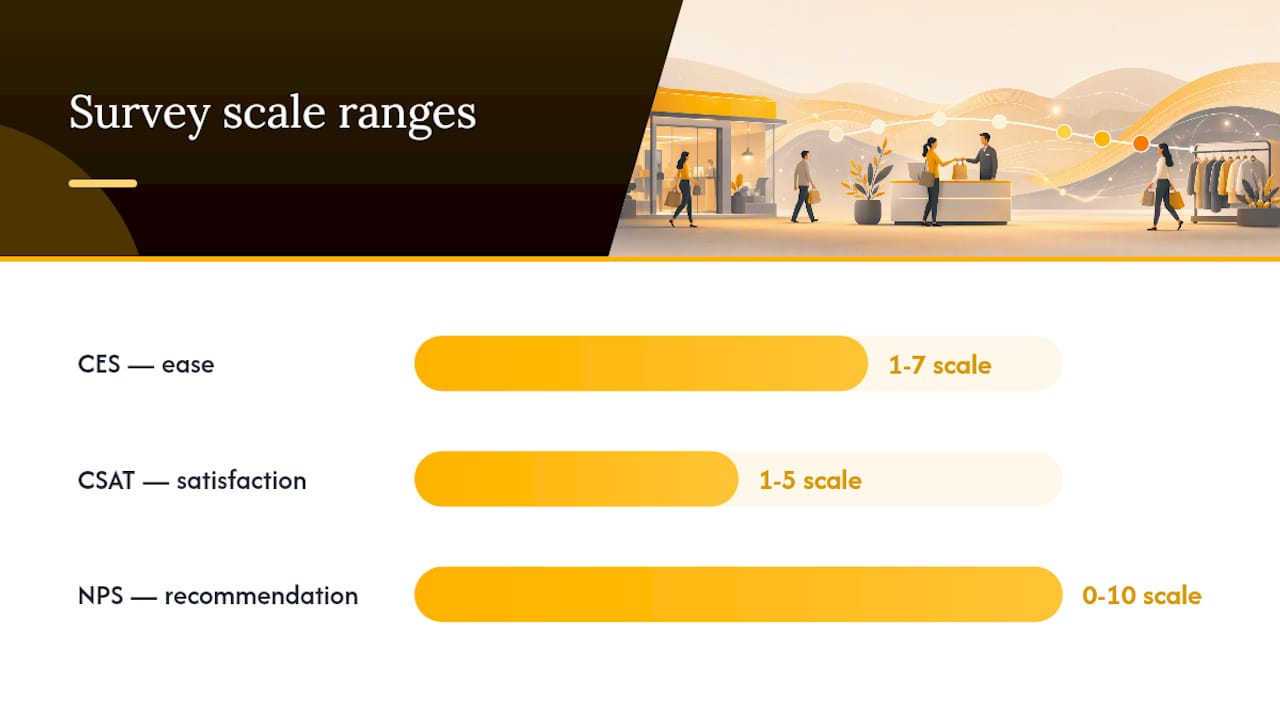
CSAT (Customer Satisfaction Score) asks “How satisfied were you with this experience?” on a 1–5 scale. It captures emotional reaction to a specific interaction and is best used immediately after a service event where you want to know whether the customer felt good about the outcome.
NPS (Net Promoter Score) asks “How likely are you to recommend us?” on a 0–10 scale. It measures long-term brand sentiment and advocacy. NPS is a relationship metric, best deployed quarterly or after a significant brand milestone.
CES asks how easy the interaction was. It is the most operationally specific of the three — it points directly at process friction rather than emotional state or brand affinity.
When to use each in retail:
- Post-support contact or complaint resolution: CES. You want to know whether the resolution process was easy, not whether the customer is happy in general.
- Post-purchase (in-store or online): CES for checkout ease; CSAT for product or associate satisfaction.
- Quarterly brand health check: NPS. This is where you measure whether your overall CX investments are building advocacy.
- Returns and exchanges: CES is the primary metric; CSAT can supplement if you want to capture emotional tone.
| Metric | Core question | Best retail use case | Scale |
|---|---|---|---|
| CES | How easy was it? | Post-interaction: checkout, return, support | 1–7 |
| CSAT | How satisfied were you? | Post-purchase, post-associate interaction | 1–5 |
| NPS | Would you recommend us? | Quarterly relationship health | 0–10 |
How to measure CES in retail: question wording, timing, and calculation
Recommended question wording
The CES v2.0 standard uses: “How easy was it to resolve your issue today?” on a 1–7 scale. For retail contexts where the customer completed a task rather than resolved a problem, adjust to: “How easy was it to complete your purchase today?” or “How easy was it to process your return today?” The phrasing should match the specific interaction.
Gartner’s updated CES guidance recommends keeping the question focused on the customer’s effort, not the company’s performance. Avoid phrasing like “Did we make it easy?” — that shifts the frame to the brand and reduces response accuracy.
Scale options and calculation
The 1–7 scale is the most widely used for CES. Calculate your score two ways:
- Mean score: Sum all responses ÷ number of responses. Useful for trend tracking over time.
- Top-box %: Percentage of respondents scoring 6 or 7. More actionable for operational targets because it isolates the “easy” segment clearly.
HubSpot’s CES explainer notes that top-box % is generally more useful than mean score when using a 7-point scale, because the mean can mask a bimodal distribution where many customers rated 2 and many rated 7.
Timing and channels
Survey immediately after the interaction — within minutes for digital channels, within 24 hours for in-store. Delayed surveys capture memory of the experience, not the experience itself, which reduces accuracy.
Channel recommendations by retail context:
- E-commerce checkout: Embedded post-purchase survey on the confirmation page or in the order confirmation email.
- In-store return or checkout: Receipt link, kiosk at exit, or SMS sent within one hour.
- Post-support call or chat: Automated survey triggered at session close.
- Delivery resolution: Email or SMS sent within two hours of delivery confirmation or issue closure.
IBM’s CES practitioner guide recommends keeping the survey to one or two questions maximum — the CES question plus one open-text follow-up (“What made this difficult?”) — to maintain response rates above 20%.
What are good CES benchmarks for retail?
Retail CES benchmarks vary by channel and interaction type. Resonate CX’s benchmark data provides industry bands that give retail teams a realistic starting point.
The ACSI’s retail benchmarks for online retailers track ease-of-checkout and ease-of-navigation as scored dimensions, giving you a category-level reference point to triangulate your own CES results against industry expectations.
Pro Tip: Set phased targets rather than chasing a single benchmark. Establish your baseline in month one, target a 5-point top-box improvement by month six in your lowest-scoring channel, and revisit the 12-month target only after you have root-cause data from the first two quarters. Chasing an industry benchmark before you understand your own friction sources is a common trap.
Which retail touchpoints create the most customer effort?
Effort does not distribute evenly across the customer journey. Certain touchpoints consistently generate the most friction, and those are where CES measurement pays off fastest.
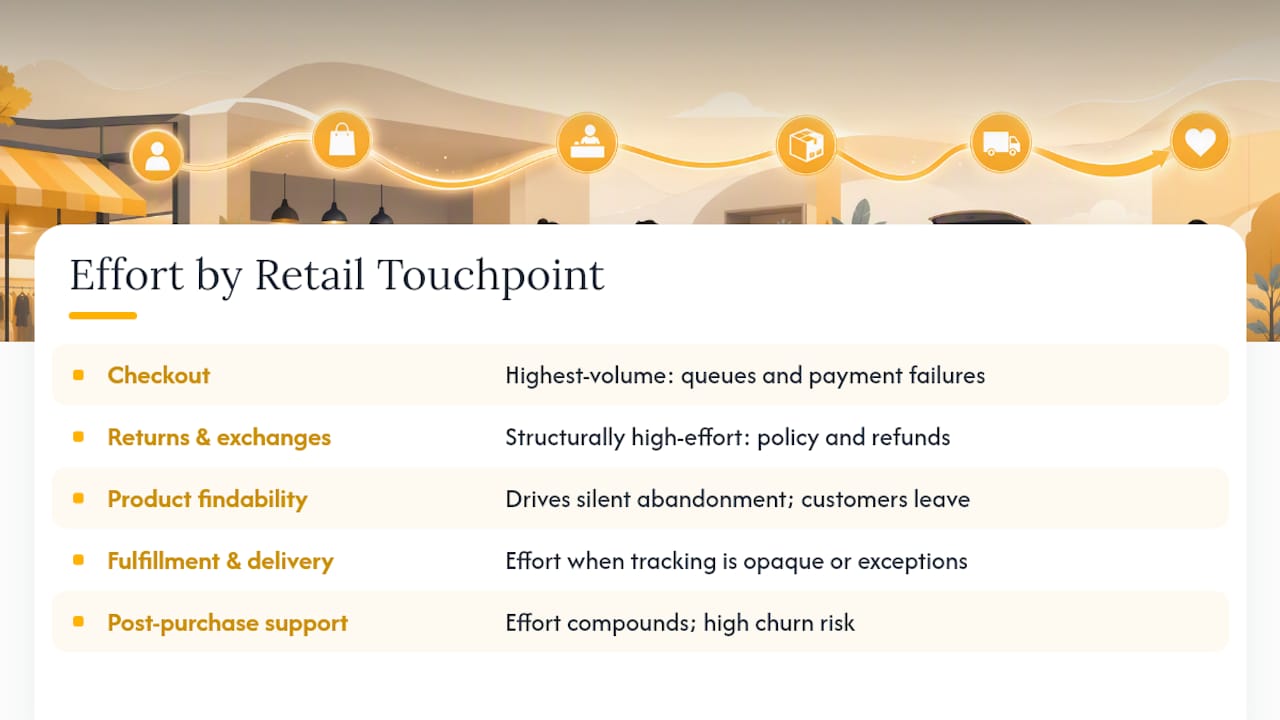
Checkout (in-store and online) is the single highest-volume effort moment. Long queues, payment failures, and multi-step digital checkout flows all spike effort scores. HappyOrNot’s Retail CX Pulse, which analyzed 18.7 million in-store customer feedback responses, identifies predictable daily and weekly pressure patterns that cause satisfaction to drop — typically during peak traffic windows when staffing does not scale proportionally.
Returns and exchanges are structurally high-effort. Customers must locate a policy, gather documentation, travel to a store or ship a package, and wait for a refund. Each additional step is a friction point. Formbricks’ CES benchmark analysis identifies returns as one of the primary drivers of low CES in online retail specifically.
Product findability drives silent abandonment. A customer who cannot find a product in-store or filter effectively online rarely complains — they leave. CES surveys placed at search or browse exit points can surface this friction before it becomes a lost sale.
Fulfillment and delivery generate effort when tracking is opaque or when delivery exceptions require a customer to contact support. A proactive notification system reduces inbound contacts and the effort associated with them.
Post-purchase support is where effort compounds. A customer who already struggled with a product and then faces a difficult support interaction is at high churn risk. Instrument this touchpoint with CES before any other.
Prioritize measurement at checkout and returns first — they have the highest volume and the most direct connection to repurchase behavior. Add fulfillment and support next, then product findability as your program matures.
Prioritized strategies to reduce customer effort in retail
The highest-impact fixes tend to be process simplifications, not technology investments. Start here:
- Simplify the return process. Reduce the number of steps to initiate a return to three or fewer. Offer label-free drop-off options where possible. A frictionless return policy is one of the strongest repurchase drivers in e-commerce. Pair this with high-touch service practices for high-value customers to close the loop personally.
- Reduce checkout steps. Audit your digital checkout for unnecessary form fields, forced account creation, and payment friction. Every removed step measurably improves CES. In-store, ensure staffing levels match peak traffic windows identified by tools like HappyOrNot’s pressure mapping.
- Build self-service order tracking. A real-time tracking page that answers “Where is my order?” without requiring a support contact eliminates a significant volume of inbound effort. Measure the contact deflection rate alongside CES.
- Improve search and filtering. For e-commerce, invest in search relevance and filter logic before investing in personalization. Customers who cannot find what they came for generate zero revenue regardless of how personalized the experience is.
- Train frontline teams on first-contact resolution. A support interaction that requires a customer to call back or escalate doubles the effort score. Customer service training focused on resolution authority and knowledge depth is a direct CES lever.
- Proactive delivery communication. Send status updates at key fulfillment milestones without requiring the customer to ask. This reduces inbound contacts and the effort associated with chasing order status.
Expected operational benefits from these fixes include reduced inbound contact volume, higher conversion rates at checkout, and lower return-related support contacts — all of which reduce cost per transaction alongside improving CES.
Best practices for running a CES program in retail
A CES program that generates reliable data requires discipline in sampling, segmentation, and action routing. Effective survey design is the foundation — a poorly timed or ambiguously worded survey produces noise, not signal.
Sampling guidelines:
- Survey a consistent percentage of transactions rather than all of them to avoid response bias from self-selection.
- Aim for a minimum of 100 responses per touchpoint per reporting period before drawing trend conclusions.
- Rotate survey timing slightly (immediately post-interaction vs. one hour later) to test for recency effects.
Segmentation checklist:
- By channel: in-store vs. online vs. phone vs. chat.
- By product category: returns rates and effort often vary significantly by category.
- By store or region: operational differences between locations show up clearly in CES.
- By customer cohort: new customers typically score lower than returning ones; track both separately.
- By reason for contact: a return driven by a sizing issue has different root causes than one driven by a defect.
Action workflow:
When a customer scores 1–3 (low effort, high difficulty), route the response to a rapid-remediation queue within 24 hours. Assign a frontline team member to follow up personally for high-value customers. Feed the open-text responses into a weekly root-cause review attended by operations, product, and CX leadership. Structural patterns — not individual complaints — are what drive program improvement. Customer care improvement strategies that connect CES signals to operational changes are what separate programs that move metrics from those that just measure them.
Common mistakes retail teams make with CES programs
Measurement errors are as damaging as operational ones. Watch for these:
- Surveying too late. A CES survey sent 48 hours after a return is processed measures memory, not experience. Send within one hour of interaction close.
- Small or uncontrolled samples. Drawing conclusions from 12 responses in a week produces false signals. Set a minimum threshold before reporting trends.
- Ignoring open-text responses. The 1–7 score tells you that there is friction. The open text tells you where and why. Skipping text analysis leaves the most actionable data on the table.
- Acting on week-to-week noise. CES fluctuates naturally. A single bad week does not indicate a structural problem. Look for consistent patterns across four or more weeks before changing a process.
- No root-cause step before fixing. A low CES on returns could mean the policy is confusing, the form is broken, or the refund timeline is too long. Fixing the wrong thing wastes resources and may not move the score.
- Treating CES as a standalone metric. CES tells you about effort; it does not tell you about satisfaction with the outcome or long-term brand health. Run it alongside CSAT and NPS for a complete picture.
Three retail-ready CES survey templates
Template 1: Post-purchase delivery
Question: “How easy was it to receive your order today?” Scale: 1–7 (1 = Extremely difficult, 7 = Extremely easy) Timing: Send via email or SMS within two hours of delivery confirmation. Follow-up: “What, if anything, made this difficult?” (open text, optional) Routing: Scores 1–3 go to a delivery-experience remediation queue; scores 6–7 are tagged for positive pattern analysis.
Template 2: In-store return
Question: “How easy was it to complete your return today?” Scale: 1–7 Timing: Receipt link or SMS within one hour of transaction close. Follow-up: “What could we have done to make this easier?” (open text) Routing: Scores 1–3 trigger a same-day manager review; scores 4–5 feed into the weekly root-cause review.
Template 3: Post-support interaction
Question: “How easy was it to resolve your issue today?” (standard CES v2.0 wording) Scale: 1–7 Timing: Automated trigger at chat or call session close. Follow-up: “What made this difficult?” (open text) Routing: Scores 1–2 escalate to a senior agent callback within four hours for high-value customers; all open-text responses enter the weekly root-cause queue.
Follow-up playbook for dissatisfied high-value customers: Identify customers scoring 1–3 who have made two or more purchases in the past 90 days. Assign a dedicated agent to contact them within 24 hours, acknowledge the friction specifically (not generically), and offer a concrete resolution. Close the loop with a confirmation message. This segment has the highest churn risk and the highest recovery value.
Which metrics should you track alongside CES?
CES gains explanatory power when correlated with operational and business metrics. Connecting customer feedback to revenue outcomes is what turns a measurement program into a growth lever.
Key metrics to pair with CES:
- First Contact Resolution (FCR): Low FCR and low CES almost always appear together. Improving FCR is one of the fastest ways to move CES in support channels.
- Average Handle Time (AHT): High AHT often signals that agents lack resolution authority or knowledge, which creates customer effort. Track AHT by interaction type alongside CES.
- Return rate by product category: A high return rate paired with low CES on returns points to a product description or sizing accuracy problem, not a process problem.
- Conversion rate at checkout: A drop in conversion rate that coincides with a CES decline at checkout confirms a friction event rather than a demand shift.
- Repeat purchase rate: The ultimate downstream validation of CES improvement. Segment by customers who scored 6–7 vs. 1–3 and compare 90-day repurchase rates.
- NPS trend: CES improvements should eventually show up in NPS as customers accumulate low-effort experiences. A rising CES with a flat NPS suggests the effort fix is isolated to one touchpoint and broader relationship issues remain.
Example correlation exercise: Pull your CES scores for the returns touchpoint by product category for the past 90 days. Cross-reference with return rate for the same categories. Categories with both high return rates and low CES scores have a product-description or expectation-setting problem — the fix is upstream in content, not in the returns process itself.
When should you engage a managed CX partner for your CES program?
Three clear signals indicate that internal resources are not enough to execute CES-driven improvements at the required pace.
First, sustained low CES across multiple channels despite internal fixes suggests a structural capacity problem, not a process design problem. Second, the inability to execute cross-functional changes — where CES data identifies a fix that requires coordination across operations, product, and support teams but no one owns the outcome — is a governance gap that a managed partner can fill. Third, rapid scaling requirements, particularly for multilingual support or seasonal volume spikes, exceed what most internal teams can staff and train in time.
A managed CX partner contributes to CES programs in specific ways:
- Program design and survey operations: Configuring survey triggers, managing sampling logic, and ensuring data quality across channels.
- Root-cause analytics: Analyzing open-text responses at scale and surfacing structural patterns that internal teams miss when reviewing responses manually.
- Tactical remediation staffing: Nearshore agents who handle high-effort escalations, follow-up contacts, and returns processing with the speed and consistency that CES-driven SLAs require.
- Ongoing governance: Weekly and monthly CES review cadences that keep cross-functional teams aligned on priorities and accountable for outcomes.
KPIs a managed partner can directly influence include reduced inbound contact volume, improved top-box CES scores within defined SLA windows, and faster remediation response times for dissatisfied high-value customers. Retail CX growth strategies that connect CES improvements to measurable revenue outcomes are the standard Altiamcx applies to every engagement.
A practitioner’s perspective on CES in retail
The most common mistake retail CX teams make with CES is treating it as a reporting metric rather than an operational trigger. Teams spend weeks building dashboards and debating benchmark comparisons when the highest-value action is almost always obvious from the first 200 responses: one or two touchpoints are generating the majority of low scores, and the open-text responses explain exactly why.
The sequencing question matters more than the benchmark question. Fix the highest-volume, lowest-CES touchpoint first, regardless of whether it is the most strategically interesting one. Returns and checkout generate more interactions per week than any other retail touchpoint, which means a 10-point top-box improvement there moves more customers than a 20-point improvement in a low-volume channel.
One trade-off worth naming directly: speed versus accuracy in survey timing. Sending a CES survey immediately after checkout captures the freshest signal but can feel intrusive if the customer is still in the store. Waiting an hour improves response quality for in-store interactions but reduces response rates. The right answer depends on your channel mix. For digital, immediate is almost always better. For in-store, a receipt link that the customer can complete on their own timeline tends to produce higher-quality open-text responses without the intrusiveness of a real-time prompt.
The structural fixes — simplified returns, faster checkout, proactive delivery communication — are not complicated. What makes them hard is the cross-functional ownership required to execute them. CES data is most powerful when it is used to build that ownership, not just to report on outcomes.
Altiamcx scales CES-driven fixes for retail teams
Retail teams that have identified their highest-effort touchpoints through CES measurement often face the same bottleneck: the capacity to act on what the data shows. Altiamcx delivers the operational infrastructure to close that gap — rapidly deployed nearshore agents, bilingual support capabilities, and measurable SLAs tied directly to CES improvement targets.

Where internal teams struggle to staff returns handling, post-purchase support, and omnichannel escalation at the speed CES programs demand, Altiamcx provides scalable team extension without the overhead of full-time hiring. The nearshore team extension model is built for exactly this: fast deployment, cultural alignment with US retail customers, and performance governance that keeps CES targets front and center. Clients have seen measurable productivity and service quality improvements — as demonstrated in Altiamcx’s managed CX case study showing an 89% productivity improvement after migrating technical support operations.
Ready to turn your CES data into operational results? Contact Altiamcx to discuss a managed CX engagement built around your retail effort-reduction priorities.
Sources
- Effortless experience explained | Gartner
- Online retailers | ACSI
- Stop trying to delight your customers | Harvard Business Review
- What Is Customer Effort Score? The Complete 2026 Guide | Resonate CX