
TL;DR:
- Operational efficiency is the ratio of useful output to total input, which improves through structured, repeatable processes. Implementing frameworks like DMAIC and process mapping can achieve significant cost reductions and cycle time improvements within 8 to 16 weeks. Sustaining gains requires ongoing monitoring, clear ownership, and regular reviews to prevent regression over time.
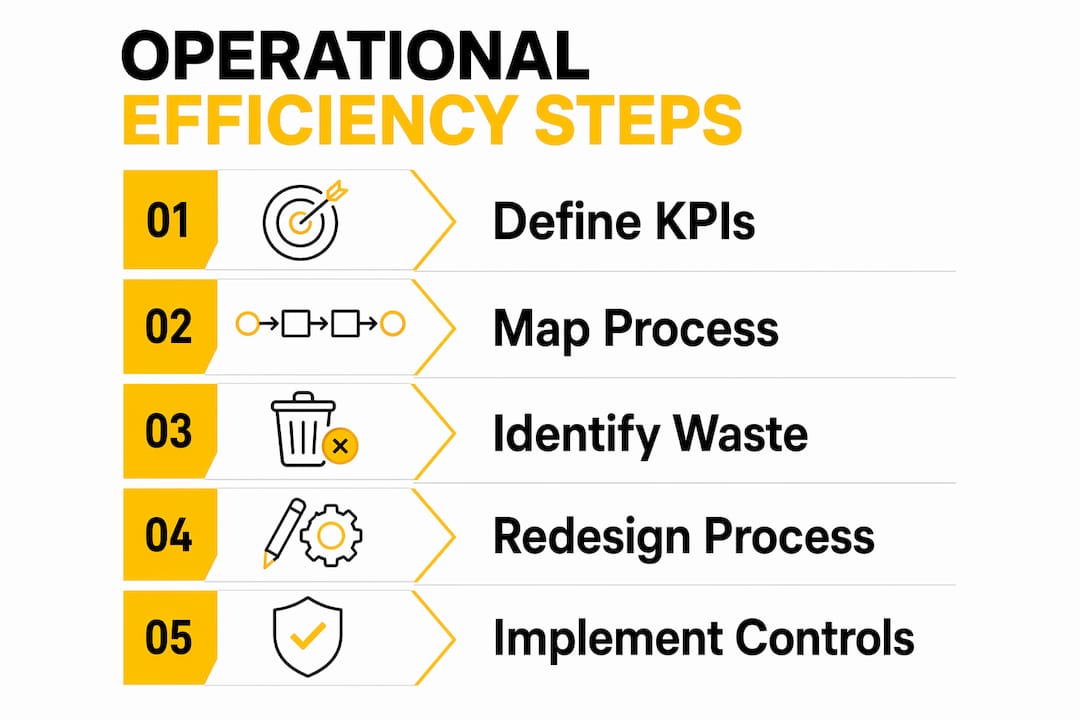
Operational efficiency is defined as the ratio of useful output to total input, and improving it requires a structured, repeatable process rather than one-off fixes. A well-executed operational efficiency step by step program can deliver 15–30% cost reductions and 40–60% cycle time improvements within 8–16 weeks. The frameworks that make this possible, including DMAIC from Lean Six Sigma, value stream mapping, and process automation platforms, give operations managers a proven path from baseline measurement to sustained performance gains. This guide walks you through each phase in sequence.
What do you need before starting operational efficiency step by step?
The single biggest reason efficiency projects stall is starting without a measurable baseline. Before you redesign anything, you need data that reflects how your operations actually perform today, not how you think they perform.
Define your kpis first
The four KPIs that matter most at the start are cycle time, throughput, first-pass yield, and cost per transaction. These metrics give you a complete picture of speed, volume, quality, and cost in a single dashboard view. Without them, you are guessing at where the problems are.
The table below outlines the core tools and requirements for launching an improvement program:
| Requirement | Tool or Method | Purpose |
|---|---|---|
| Baseline KPIs | Asana, Oracle MOC | Track cycle time, throughput, cost per transaction |
| Process documentation | BPMN software, flowchart tools | Visualize current-state workflows |
| Process mining | Celonis, UiPath Process Mining | Discover actual process flows from system logs |
| Cross-functional team | Internal stakeholders, sponsors | Validate data and drive accountability |
| Monitoring dashboard | Oracle MOC, Power BI | Real-time visibility into performance |
Oracle’s Manufacturing Operations Center tracks cycle time, run time, down time, and idle time per shift using ISA-95 integration with ERP systems. That level of granularity is what separates a real baseline from a rough estimate.
Three additional requirements before you begin:
- Leadership buy-in: Sponsors must authorize resource allocation and process changes. Without sign-off, improvement work stalls at the first cross-departmental friction point.
- Accurate data collection: Garbage data produces garbage baselines. Audit your data sources before you trust any number.
- Defined scope: Limit the initial project to one process or one department. Broad scope kills momentum.
Pro Tip: Use a process mining tool like Celonis or UiPath Process Mining to generate your current-state process map automatically from system logs. This eliminates the bias that comes from interviewing people about what they think happens versus what the data shows.
How to map, measure, and analyze your current operations
Process mapping is the foundation of every credible efficiency improvement. Mapping actual operations, not the idealized version in your procedure manual, is what exposes hidden waste and rework loops.

Build your current-state process map
Start by documenting every step in the process as it actually runs today. Walk the process physically or trace it through your systems. Capture decision points, handoffs, wait times, and rework loops. The goal is a current-state map that any team member would recognize as accurate.
Once the map exists, layer in your metrics. For each step, record cycle time (how long the step takes), wait time (how long work sits before the step starts), and error rate (how often the output requires rework). These three numbers give you the raw material for calculating process cycle efficiency, which is value-added time divided by total lead time.
Use value stream mapping to identify waste
Value stream mapping (VSM) converts your process steps into a visual timeline that separates value-added activity from waste. A typical VSM reveals that only 10–30% of total lead time is actually value-added. The rest is waiting, rework, or unnecessary movement.
The comparison table below shows how three common analysis methodologies differ in scope and application:
| Methodology | Best For | Output | Time to Complete |
|---|---|---|---|
| Value Stream Mapping | End-to-end flow analysis | Visual map with time data | 1–3 days |
| DMAIC (Define, Measure, Analyze) | Root cause analysis and structured improvement | Data-driven project charter | 8–16 weeks |
| BPMN Process Mapping | Documenting workflows for automation | Standardized process diagrams | 2–5 days |
The DMAIC methodology structures root cause analysis across three initial phases. Define sets the problem statement and project scope. Measure captures baseline data with statistical rigor. Analyze identifies root causes using tools like fishbone diagrams and Pareto charts. Each phase produces a documented output that feeds the next.
The most common pitfall in this stage is treating the Measure phase as a formality. Poor baseline data quality is the single most frequent bottleneck in improvement projects. If your data is incomplete or inconsistent, your root cause analysis will point you at the wrong problems.
Pro Tip: Before finalizing your baseline metrics, run a measurement system analysis (MSA) to verify that your data collection method is consistent and repeatable. An MSA takes one to two days and prevents weeks of wasted analysis downstream.
You can find real-world examples of how DMAIC has been applied in professional services to cut cycle times and reduce error rates significantly.
What are the practical steps to redesign and improve your processes?
Process redesign follows a specific sequence. Skipping steps or automating before stabilizing is the most common reason efficiency projects produce short-term gains that disappear within six months.
Here is the recommended sequence for operational process optimization:
- Eliminate waste first. Apply Lean principles to remove non-value-added steps: unnecessary approvals, duplicate data entry, and redundant handoffs. This step costs nothing and often produces the fastest gains.
- Standardize the remaining steps. Create standard operating procedures (SOPs) for every step that survives the waste elimination review. Standardization is the prerequisite for measurement and automation.
- Apply quick wins. Replace manual approval chains with pre-approved decision rules. Build templates for repetitive outputs. These changes can be deployed in days and typically reduce cycle time by 15–25%.
- Stabilize before automating. Automating an unstable process encodes its inefficiencies into your automation tools. Confirm that the redesigned process runs consistently for at least two to four weeks before deploying any automation.
- Deploy automation with monitoring. Use robotic process automation (RPA) tools or workflow platforms to handle high-volume, rule-based tasks. Build in alerts and fallback procedures for exceptions.
- Pilot before full rollout. Run the redesigned process in one team or one location first. Measure cycle time, error rate, and throughput against your baseline. Validate the gains before scaling.
- Scale with documented controls. Once the pilot confirms the target metrics, roll out the new process with full SOPs, training materials, and a named process owner.
Sequencing improvements by constraint and stabilizing before scaling is the approach used in operational excellence roadmaps that span three-year horizons. The principle applies equally to a 12-week project.
Pro Tip: When selecting automation targets, prioritize tasks with high volume, low variation, and clear rules. Tasks with frequent exceptions or judgment calls will require significant rework after automation and often cost more than they save in the first year.
For a detailed look at how this sequence applies to back-office functions, the back-office optimization guide from Altiamcx covers the full process with function-specific examples.
How do you sustain operational efficiency improvements over time?
Most efficiency gains erode within 12 months if the project ends without a formal control structure. Standard work, training, control plans, and ongoing monitoring are the four components that prevent this erosion.
The DMAIC Control phase is where most projects fail. Teams declare victory after the Improve phase and move on to the next project. Six months later, the process has drifted back toward its old behavior because no one owns the new standard.
Four practices that sustain gains over time:
- Assign a named process owner. This person is accountable for the process metrics, not just the process steps. They review performance data weekly and escalate deviations.
- Use statistical process control (SPC). Control charts track whether a process is operating within its expected range. A point outside the control limits triggers investigation, not just a note in a meeting.
- Run short improvement cycles. Kaizen events and PDCA (Plan-Do-Check-Act) cycles keep the team engaged with continuous improvement rather than treating efficiency as a completed project.
- Build role-specific dashboards. Mixing operator and manager KPIs on the same dashboard overloads users and reduces the likelihood that anyone acts on the data. Executives need trend lines. Operators need real-time alerts.
Operational efficiency should be treated as a repeatable ratio, not a one-time project. The organizations that sustain gains are the ones that build measurement and ownership into their operating rhythm, not their project calendar.
Refresh rates matter as much as the metrics themselves. Operator dashboards should update in near real time. Manager dashboards work well on a daily or shift-based cadence. Executive dashboards are most useful on a weekly or monthly view. Mixing these cadences on a single screen dilutes the signal for every audience.
Key takeaways
Operational efficiency improves sustainably when you sequence measurement, redesign, automation, and control in that exact order, with named ownership at every stage.
| Point | Details |
|---|---|
| Establish a measurable baseline | Track cycle time, throughput, first-pass yield, and cost per transaction before changing anything. |
| Map actual operations | Document what really happens, not the ideal process, to expose hidden waste and rework. |
| Stabilize before automating | Confirm the redesigned process runs consistently for two to four weeks before deploying automation. |
| Assign process ownership | Name a process owner accountable for metrics, not just steps, to prevent gains from eroding. |
| Tailor dashboards by role | Separate KPI sets and refresh rates for operators, managers, and executives to keep data actionable. |
What i have learned about efficiency programs that most guides skip
By Daniela
The part of operational efficiency work that surprises most operations managers is how long the Measure phase actually takes. Teams routinely budget one week for baseline data collection and then spend four weeks cleaning data, reconciling system discrepancies, and rebuilding measurement processes from scratch. The DMAIC framework is sound, but its Measure phase is consistently underestimated in project plans.
The second thing I have seen derail otherwise solid programs is premature automation. The pressure to show technology ROI pushes teams to automate before the process is stable. The result is a faster version of a broken process. Every automation deployment I have seen succeed started with at least two weeks of stable manual operation under the new design.
The third pattern worth naming is the handover gap. Projects end. Process owners get reassigned. Control plans sit in a shared drive that no one opens. The teams that sustain efficiency gains treat the Control phase as a permanent operating system, not a project deliverable. They schedule quarterly reviews, keep sponsors engaged, and treat a metric drift as a trigger for a Kaizen event rather than a reason to launch a new project.
If you are planning an efficiency program, build your timeline around 8–16 weeks minimum, budget twice as long for measurement as you think you need, and treat the handover as the most critical milestone on your project plan.
— Daniela
How Altiamcx supports your efficiency improvement program
Altiamcx works with operations teams that are ready to move from process maps to measurable performance gains. The combination of disciplined execution, real-time performance frameworks, and experienced nearshore teams means you get both the analytical rigor and the operational capacity to run improvement programs without pulling your core team off their day jobs.

One software platform that migrated its tech support operations to Altiamcx achieved an 89% productivity improvement by applying the same sequenced approach covered in this guide. If you are at the stage where you need a partner to help execute, monitor, and sustain your efficiency work, Altiamcx is built for exactly that.
FAQ
What is operational efficiency and how is it measured?
Operational efficiency is the ratio of useful output to total input, tracked as a repeatable metric over time. Key measures include cycle time, throughput, first-pass yield, and cost per transaction.
How long does an operational efficiency program take?
A structured program using DMAIC or a comparable framework typically delivers measurable results within 8–16 weeks. Sustaining those results requires ongoing monitoring and process ownership beyond the initial project.
Should you automate before or after redesigning processes?
Always redesign and stabilize the process before automating. Automating an inefficient process encodes its flaws into your tools and increases the cost of correction later.
What causes efficiency gains to erode after a project ends?
The most common cause is the absence of a formal Control phase. Without standard work, named process ownership, and SPC monitoring, processes drift back toward old behavior within 6–12 months.
What kpis should operations managers track for efficiency?
The four most useful KPIs are cycle time, throughput, first-pass yield, and cost per transaction. These cover speed, volume, quality, and cost and give a complete operational picture when tracked together on a role-specific dashboard.