
TL;DR:
- Service quality directly influences customer satisfaction and purchase intention across sectors.
- The SERVQUAL model assesses five dimensions to diagnose and improve service quality gaps.
- Sector-specific benchmarks guide organizations to target meaningful improvements and achieve world-class performance.
Service quality is not a soft metric. It is a direct predictor of revenue, retention, and competitive position. Research confirms that service quality drives satisfaction with a beta coefficient of 0.736 and influences purchase intention at 0.794, numbers that translate directly into business outcomes for healthcare, legal, and e-commerce organizations. Yet most decision-makers still rely on incomplete diagnostics, sector-agnostic targets, and technology deployments that miss the real drivers of client loyalty. This article cuts through the confusion by connecting evidence-backed frameworks, sector-specific benchmarks, and practical implementation strategies that help you measure, diagnose, and elevate service quality where it truly counts.
Table of Contents
- What defines service quality in professional sectors?
- Benchmarks: How do you know your service quality is world-class?
- Frameworks and real-world diagnostics: Implementing SERVQUAL for breakthroughs
- The digital nuance: Trust, self-service, and expectations
- What most organizations miss: Practical wisdom from the trenches
- Elevate your service quality with nearshore CX solutions
- Frequently asked questions
Key Takeaways
| Point | Details |
|---|---|
| Frameworks guide impact | SERVQUAL and RATER models help pinpoint what needs fixing and how to measure progress. |
| Benchmarks matter | CSAT and NPS show where your sector stands—world-class scores are rare but achievable. |
| Digital shift changes expectations | Technology, especially self-service, alters trust and perceived quality in healthcare and e-commerce. |
| Recurring diagnostics drive results | Continuous surveys and micro-segmentation yield actionable steps and meaningful improvements. |
What defines service quality in professional sectors?
Now that we’ve established service quality’s direct impact, let’s break down what leading frameworks reveal about its core dimensions.
Service quality is not a single variable. It is a construct built from both objective performance data and subjective client perception. The gap between what clients expect and what they actually experience is where service quality lives, and closing that gap is where competitive advantage is won.
The most widely validated tool for measuring that gap is the SERVQUAL model, also known as RATER. It organizes service quality into five measurable dimensions:
- Reliability: Delivering promised services accurately and consistently
- Assurance: Staff knowledge, courtesy, and ability to inspire trust
- Tangibles: Physical environment, equipment, and communication materials
- Empathy: Individualized attention and genuine care for clients
- Responsiveness: Willingness to help promptly and address issues quickly
These five dimensions are measured using expectation-perception surveys, where clients rate both what they expect and what they receive. The difference between those two scores reveals your service quality gaps. Prioritizing the largest gaps gives you the highest-impact targets for improvement.
What makes this framework especially powerful is its flexibility across sectors. The executive guide to service quality consistently shows that sector context shapes which dimensions matter most. Healthcare organizations must prioritize empathy and assurance because patients are emotionally vulnerable and trust is non-negotiable. Legal firms depend heavily on assurance because clients are navigating high-stakes decisions and need to feel confident in their representation. E-commerce companies, by contrast, compete most aggressively on responsiveness and tangibles, where speed of resolution and the quality of digital interfaces directly shape satisfaction.
This is not simply theoretical. Research confirms that service quality impacts satisfaction at a beta coefficient of 0.736 and purchase intention at 0.794. These figures are not marginal. They represent a powerful statistical relationship that means even modest improvements in service quality produce measurable lifts in both satisfaction scores and actual buying behavior.
Sector-specific nuances also affect how you collect and interpret survey data. For healthcare, empathy scores often diverge significantly between patient-facing and administrative interactions. For legal firms, assurance gaps tend to appear most sharply during onboarding and case update communications. For e-commerce, responsiveness gaps are most visible during peak demand periods or post-purchase resolution. Aligning your diagnostic approach with these sector realities is essential for surfacing actionable insights rather than generic scores.
For organizations looking to apply these insights operationally, customer care improvement tips and client management solutions provide structured frameworks for translating SERVQUAL findings into specific team and process improvements.

Benchmarks: How do you know your service quality is world-class?
With dimensions defined, let’s see how your organization measures up against sector benchmarks and what those numbers truly mean.
Most organizations know they should measure satisfaction, but few benchmark against targets that actually reflect what world-class performance looks like. Knowing whether your CSAT is “good” requires context. A score that earns praise in one sector may signal underperformance in another.
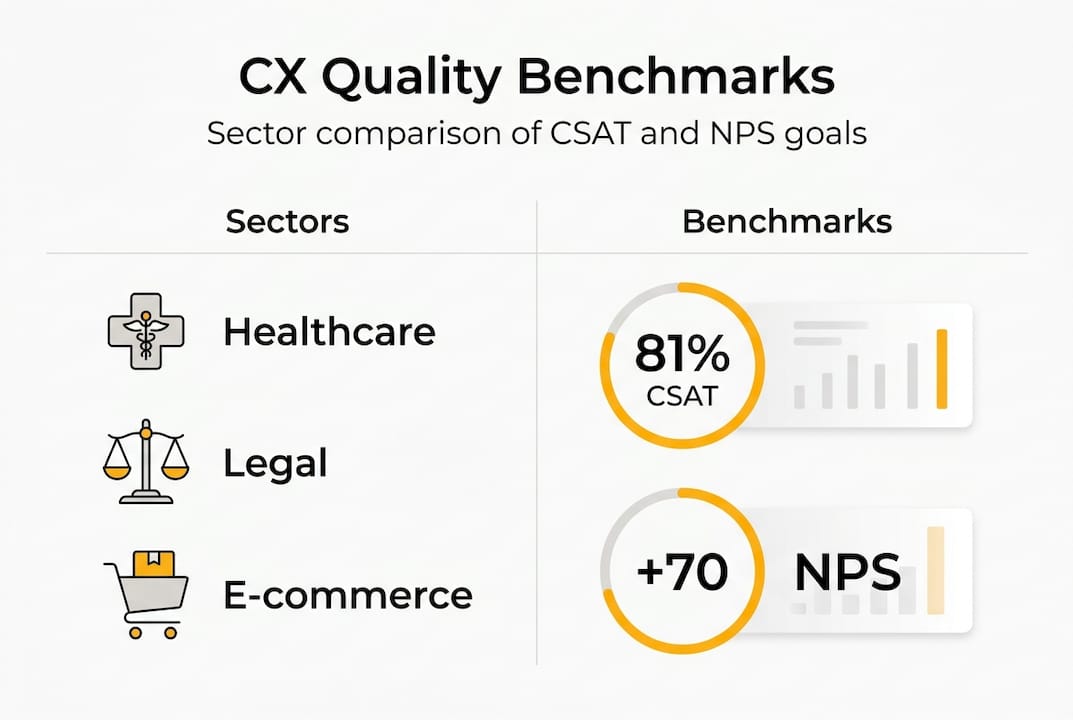
Here is a clear picture of current benchmarks across the three core sectors:
| Sector | CSAT Benchmark | NPS Benchmark | World-Class Target |
|---|---|---|---|
| Healthcare | 81% | Varies by provider | ACSI Hospital 77 |
| Legal | Not widely published | 32 (industry avg) | NPS 70+ |
| E-commerce / Retail | 82% | Varies | CSAT 85%+ |
CSAT data places healthcare at 81% and e-commerce at 82%, with world-class performance starting at 85% or above. That 3-4 point gap between average and world-class is not cosmetic. It represents the difference between clients who are satisfied and clients who actively advocate for your brand.
For legal services, NPS benchmarks tell a more nuanced story. The industry average NPS sits at 32, which reflects the inherent complexity of legal relationships and the difficulty of delivering consistently exceptional experiences in high-pressure environments. Excellent NPS begins at 50, and world-class performance reaches 70 or above. Achieving NPS above 70 in legal services requires not just good case outcomes but exceptional communication, responsiveness, and trust-building throughout the client relationship.
“Service quality isn’t subjective. World-class scores are rare, measurable, and earned through disciplined, sector-specific execution.”
What does this mean practically? A few key implications for decision-makers:
- Good is not enough. Sitting at the industry average means half your competitors are performing at the same level. The firms that win long-term loyalty are those consistently pushing above the average threshold.
- Sector targets should guide investment decisions. If your healthcare organization scores 76 on CSAT, you’re below the sector benchmark. Investing in empathy training and communication protocols is not optional.
- Track quarterly movement, not just annual snapshots. Single-point readings miss trend signals. Progress is visible only when you track improvement quarter-over-quarter.
Pro Tip: Don’t anchor solely to industry averages. Benchmark your scores against your direct competitors and track your delta each quarter. A 2-point CSAT gain in a single quarter is a meaningful operational signal worth investigating and replicating.
For organizations working on client retention strategies, these benchmarks provide the numeric foundation for setting realistic improvement targets and communicating progress to leadership. E-commerce companies scaling their operations can also reference customer care strategies for retail to understand how responsiveness and digital experience interact with satisfaction scores at scale. Additional perspective on client retention strategy tips reinforces why hitting benchmark targets is tightly correlated with repeat purchase behavior and long-term revenue.
Frameworks and real-world diagnostics: Implementing SERVQUAL for breakthroughs
Once you know your benchmark, the question becomes: How do you really move the needle? Here’s how diagnostics and frameworks should be applied for impact.
Knowing your gaps is different from closing them. SERVQUAL provides the diagnostic clarity, but implementation requires structured execution across your teams, processes, and feedback systems.
Here is a proven approach for deploying SERVQUAL effectively in professional service environments:
- Design sector-specific surveys. Generic surveys produce generic insights. Tailor your expectation-perception questions to reflect the specific touchpoints that matter in healthcare, legal, or e-commerce contexts. For healthcare, include questions about care communication and follow-up. For legal, focus on update frequency and advisor clarity. For e-commerce, prioritize resolution speed and digital experience.
- Analyze by dimension and segment. Don’t average your results into a single score. Break down findings by each of the five RATER dimensions and by client segment. This is where actionable insights emerge.
- Prioritize the largest gaps first. The SERVQUAL methodology is explicit: close the biggest gaps for the fastest impact. If your empathy score shows a gap of 1.8 points while responsiveness shows 0.4, empathy training delivers the greater return.
- Link gaps to operational metrics. Don’t let SERVQUAL findings exist only in a survey report. Connect each gap to a measurable operational metric. If assurance is low, tie it to first-contact resolution rates. If responsiveness is lagging, link it to average handling time and escalation frequency.
- Fix, monitor, and resurvey. Implement targeted improvements and resurvey within 60 to 90 days. Recurring surveys allow you to track whether changes actually moved the needle or simply changed the team’s behavior without client impact.
Sector-specific implementation requires additional nuance. In healthcare, the trust dimension means that empathy training and consistent communication protocols need to be embedded in clinical workflows, not treated as add-ons. In legal, outsourcing legal service delivery is increasingly being used to support responsiveness and intake efficiency without compromising the assurance dimension. Many legal firms are also exploring outsourcing customer experience as a way to close service quality gaps without overextending in-house teams. For service providers focused on operational flow, streamlining service delivery provides structural approaches to improving responsiveness at scale.
Pro Tip: Always pilot SERVQUAL implementation with one team or department before rolling it out organization-wide. Pilots surface unexpected data collection issues, survey fatigue patterns, and operational blockers before they affect your entire client base.
The digital nuance: Trust, self-service, and expectations
Digital transformation is changing the playing field. Let’s examine how technology alters expectations, especially where trust and self-service are central.
Technology is not a shortcut to better service quality. It is a mediating force that reshapes client expectations and, in turn, how perceived service quality is formed. Research confirms that digital technology affects expectations both directly, with a beta of 0.315, and indirectly through adjusted client expectations at a beta of 0.237. In practical terms, this means that deploying new digital tools changes what clients expect from your service, sometimes raising the bar faster than your teams can keep up.
Here is how this plays out across the three sectors:
- Healthcare: Self-service portals, patient scheduling apps, and telehealth platforms introduce significant trust requirements. Clients using self-service tools are not simply interacting with technology. They are placing health-related trust in your organization’s infrastructure. A clunky interface or inconsistent information undermines perceived service quality even when clinical care is excellent.
- E-commerce: Technology accelerates responsiveness expectations dramatically. Customers who experience same-day shipping become intolerant of three-day resolution windows. Real-time chat, automated order tracking, and instant refund capabilities are no longer differentiators. They are baseline expectations. Failing to meet them directly suppresses CSAT.
- Legal: Digital client intake tools, secure document portals, and automated case update systems are enhancing both assurance and responsiveness scores. When clients can access real-time case updates through a secure platform, their perceived control and confidence increase, directly improving assurance dimension scores.
Understanding customer care in the legal sector requires recognizing that technology deployment must always reinforce trust rather than replace human judgment in high-stakes interactions. For organizations building sustainable digital service quality, proven steps for client retention highlight how digital consistency and transparency translate into measurable loyalty over time.
Pro Tip: After every significant digital touchpoint update, collect micro-surveys from clients within 48 hours of interaction. Real-time feedback surfaces expectation mismatches before they become satisfaction problems. Consistency and transparency in your digital channels are not features. They are the foundation of perceived service quality in a digital-first environment.
What most organizations miss: Practical wisdom from the trenches
Organizations that invest in service quality frameworks often make the same critical mistake: they treat service quality as a uniform target across their entire operation. They set a single CSAT goal, roll out standardized training, and measure progress with aggregate scores. The result is that they optimize for the average and miss the specific segments where real improvement is possible.
The truth is that real service quality gains come from micro-segmentation. Breaking your client base into meaningful cohorts, by care setting in healthcare, by practice area in legal, by product category in e-commerce, reveals where your biggest gaps actually live. A legal firm that treats all client interactions as uniform will consistently under-invest in onboarding, where assurance gaps are most severe, and over-invest in outcome communication, where clients are already more forgiving.
There is also a persistent confusion between technology upgrades and genuine quality improvement. Organizations that deploy new CRM systems or AI chat tools often see a temporary lift in scores, followed by a plateau. That plateau reveals the truth: technology changes the surface, not the underlying service quality. Only recurring SERVQUAL diagnostics, applied quarterly and tied to operational metrics, reveal what clients actually value versus what your teams assume they value.
Score chasing is another pitfall. When teams are measured on CSAT targets, they optimize for the survey rather than the experience. A client who gives a 5-star rating immediately after resolution but never returns is not a loyalty indicator. True service quality improvement is reflected in retention, referral behavior, and lifetime value, not just the next survey response.
The executive wisdom on service quality that moves organizations forward combines consistent diagnostic discipline with sector-tailored application and the organizational courage to fix what actually matters, even when it is operationally inconvenient. That means addressing training gaps that take months to close, rebuilding workflows that have existed for years, and sometimes redesigning client communication entirely. Quick fixes produce quick plateaus. Disciplined, recurring, context-driven improvement produces world-class scores.
Elevate your service quality with nearshore CX solutions
Decision-makers who have worked through frameworks, benchmarks, and digital nuance now face a practical question: where do you find the execution capacity to close these gaps at scale?

Altiam CX specializes in evidence-driven, sector-focused service quality improvements delivered through nearshore customer experience solutions. Our approach combines cultural alignment, performance measurement frameworks, and scalable team-extension models that allow healthcare, legal, and e-commerce organizations to move from benchmark awareness to measurable improvement without overextending internal resources.
Explore our nearshore customer experience outsourcing services to understand how our operational model maps directly to SERVQUAL dimensions. Review our productivity improvement case study to see how measurable CX gains are achieved in practice. Organizations in high-growth environments can also explore our fast-growth tech CX solutions for scalable, results-driven service quality support.
Frequently asked questions
Which service quality dimension matters most in healthcare?
Empathy and trust are the most critical dimensions in healthcare because satisfaction and patient outcomes are directly tied to how supported and understood patients feel throughout every interaction.
What are good CSAT and NPS scores for legal and e-commerce sectors?
The legal industry NPS benchmark is 32, with world-class performance reaching 70 or above, while e-commerce CSAT averages 82% and world-class starts at 85%.
How can SERVQUAL help quickly identify actionable service quality gaps?
SERVQUAL’s expectation-perception surveys surface the largest gaps across five dimensions, allowing organizations to prioritize the fixes that deliver the greatest impact first.
Does digital self-service affect perceived quality in healthcare?
Yes. Research confirms that digital tools affect quality perceptions both directly and indirectly through reshaped expectations, making transparency and consistency in self-service platforms essential for maintaining trust.


