
TL;DR:
- Retailers often rely on outdated satisfaction scores that overlook friction points impacting customer behavior and revenue.
- Predictive, journey-based CX metrics like NPS trends, Customer Effort Score, and return intention better forecast loyalty and financial outcomes.
- Connecting real-time operational data to these metrics enables faster, more targeted improvements that drive profitability and customer retention.
Most retail executives track customer satisfaction scores and call it a day. The problem? Those scores often look fine while customers are quietly switching to competitors. The role of CX metrics for retail goes far deeper than satisfaction ratings. Voice of the Customer (VoC) programs, when built around predictive and behavioral signals rather than legacy scores, connect directly to revenue, loyalty, and operational efficiency. This article walks retail professionals through which metrics actually matter, how to link them to commercial outcomes, and how to build measurement systems that give your entire organization something it can act on.
Table of Contents
- Key takeaways
- Why traditional CX metrics fall short in retail
- CX metrics that predict behavior and revenue
- Linking CX metric improvements to business performance
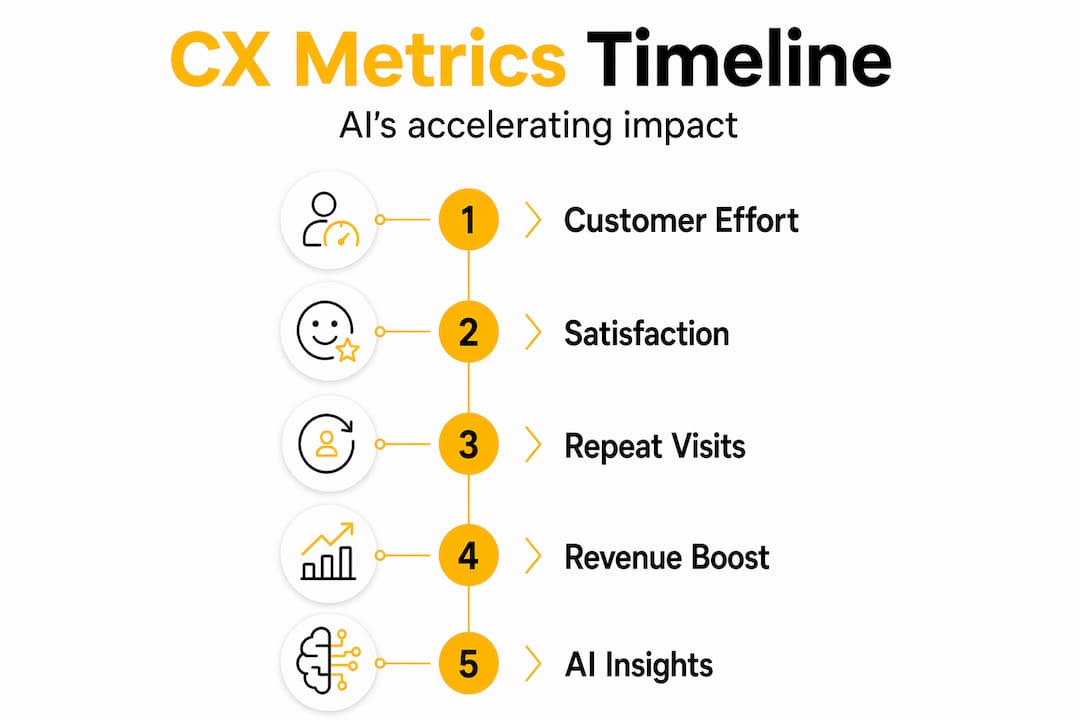
- Measurement timelines and the rise of AI in retail CX
- My perspective on what most retailers get wrong
- How Altiamcx helps retailers act on CX data
- FAQ
Key takeaways
| Point | Details |
|---|---|
| Legacy metrics miss friction | Satisfaction scores and static NPS capture isolated moments, not the full customer journey where trust erodes. |
| Predictive metrics drive revenue | NPS trends, Customer Effort Score, and return intention link directly to churn risk and purchase frequency. |
| CX connects to the P&L | Framing metric improvements against operating costs and revenue lines wins CFO support and budget. |
| Timeline expectations matter | Operational metric gains appear in 2 to 3 months; loyalty and revenue impact takes 6 to 12 months. |
| Real-time data enables action | Store-level, journey-based visibility gives frontline teams the intelligence to fix friction before it compounds. |
Why traditional CX metrics fall short in retail
Retail has a measurement problem. Not a data shortage. A measurement problem. Many organizations are running the same satisfaction surveys they deployed a decade ago, and they are getting the same kind of partial, delayed, and misleading signal in return.
Here is what is actually happening. Survey fatigue limits feedback quality, capturing only selective slices of the customer journey rather than the moments where friction actually occurs. The customers most likely to complete a post-visit survey are the ones with strong opinions at either extreme. Everyone else, the moderate majority whose behavior is actually the most commercially significant, simply does not respond.
Beyond participation gaps, there is a deeper structural issue:
- Legacy CSAT and NPS ask customers how they felt, not what they did. A shopper who rates a visit 7 out of 10 may never return. A shopper who rates it 6 may return weekly because the store is near their office. Sentiment and behavior are not the same thing.
- Static scores capture isolated interactions, missing the navigation struggles, checkout friction, or stock availability issues that happen in the moment and drive real decisions.
- Customers evaluate value based on time, effort, and cost as much as emotional satisfaction. A 4-minute checkout wait matters more to some shoppers than the friendliness of the cashier.
“Retail CX measurement must shift from static snapshots to dynamic, journey-based insights providing frontline intelligence that teams can act on immediately.”
The retailers who keep relying on monthly satisfaction averages are making decisions with data that is already weeks old and structurally incomplete. That gap between what your scores say and what your customers actually do is where revenue leaks out.
CX metrics that predict behavior and revenue
The good news is that a better measurement set exists. The shift is from asking “how satisfied were you?” to “what are you likely to do next?” The metrics below form a diagnostic set that predicts customer loyalty and guides operational priorities more reliably than any single satisfaction score.
-
NPS trend, not absolute score. A Net Promoter Score of 42 tells you very little. A score that has dropped from 55 to 42 over three quarters tells you something serious is happening. Declining NPS trends serve as early commercial warnings and correlate with transaction data to surface revenue drivers. Track direction and velocity, not just the number.
-
Customer Effort Score (CES). This metric measures how much work a customer had to do to accomplish something. Finding a product, completing a return, getting a question answered. High effort scores are one of the strongest predictors of churn. When customers repeatedly have to work hard just to transact with you, they eventually stop trying.
-
Post-visit return intention. Asking a single, behaviorally focused question at the end of a visit, specifically whether the customer intends to return, produces a more reliable signal than multi-question satisfaction batteries. Return intention bridges sentiment and actual behavior better than satisfaction alone.
-
Complaint resolution satisfaction. This one surprises most executives. Closing feedback loops systematically yields 20% higher repurchase rates. Service recovery, when handled well, builds more loyalty than simply avoiding complaints in the first place. Track how satisfied customers are with how their complaints were resolved, not just whether complaints occurred.
-
Loyalty program engagement. Engagement with loyalty programs such as points redemption frequency, offer uptake, and lapsed member rates serves as a direct commercial indicator. It connects CX experience quality to repeat purchase behavior in measurable terms.
Pro Tip: Pair NPS trend data with transaction data from your CRM or POS system. The intersection of declining sentiment and declining basket size in the same customer cohort is the most powerful early warning signal you can have.
Linking CX metric improvements to business performance
Understanding which metrics to track is step one. Getting your organization to act on them is step two. And that requires connecting CX data to the language that operations, finance, and store leadership actually speak.
Take checkout friction as an example. A high Customer Effort Score on checkout does not just mean customers are frustrated. It means you have a conversion risk at the final step of the purchase journey. Staffing to labor load peaks, which is a tactic Target used to raise store metrics to three-year highs in 2026, is the operational response. The CX metric identifies the problem. The operational lever solves it. The business result is measurable in basket abandonment rates and transaction volume.

Here is how CX metrics map to operational actions and financial outcomes:
| CX metric | Operational friction point | Business outcome |
|---|---|---|
| High Customer Effort Score | Checkout time, return process complexity | Reduced conversion, higher churn risk |
| Declining NPS trend | Product availability, staff responsiveness | Early revenue loss signal |
| Low return intention | Store layout, product findability | Lower visit frequency, reduced lifetime value |
| Complaint resolution score | Service recovery process quality | 20% higher repurchase when handled well |
| Loyalty engagement drop | Offer relevance, program friction | Direct revenue impact, lapsed customer growth |
The most effective retail CX leaders go one step further. They anchor CX business cases to P&L lines or specific operating costs, which is what gets CFO attention and budget approval. “Our CES score improved by 15 points” is interesting. “Our CES improvement reduced handle time by 30 seconds per transaction, saving $280,000 annually in labor costs” is fundable.
Pro Tip: When presenting CX metric progress to finance or operations leadership, always lead with the operational proxy, such as checkout time or return rate, before presenting the satisfaction score. Numbers that connect to cost lines land faster than experience scores alone.
Real-time, store-level visibility is what separates organizations that improve from those that only measure. Explore how retail CX investments drive results by connecting metric movement to specific store-level actions that frontline teams can take the same week they receive the data.
Measurement timelines and the rise of AI in retail CX
One of the most common mistakes retail executives make is expecting CX metric investments to show full financial return within a single quarter. The timeline reality is more layered, and understanding it prevents both premature program cancellation and inflated ROI promises.
CX operational proxies show ROI in 2 to 3 months. Things like reduced handle time, improved first-contact resolution, and faster checkout all show up on operational dashboards relatively quickly. Retention and revenue effects, the impact on repeat purchase frequency and customer lifetime value, typically take 6 to 12 months to appear in financial reporting. Full program ROI, including loyalty compounding and brand reputation effects, is a multi-year calculation.
The table below shows how to plan measurement expectations by metric type:
| Metric type | When impact shows | Where to measure |
|---|---|---|
| Customer Effort Score | 4 to 8 weeks post-change | Operational dashboards, handle time reports |
| NPS trend | 3 to 6 months | VoC platform, transaction correlation |
| Return intention | 2 to 4 months | Post-visit surveys, visit frequency data |
| Revenue contribution | 6 to 12 months | P&L, cohort analysis, basket size |
| Loyalty lifetime value | 12 to 36 months | CRM, loyalty program analytics |
The rise of AI-led CX is changing what is measurable. Platforms now connect customer intelligence to commercial outcomes by tracking purchase behavior, order frequency, product availability responses, and revenue contribution in ways that satisfaction scores never could. This matters because it closes the gap between what customers say and what they actually do. Omnichannel integration, pulling signals from physical stores, digital touchpoints, and AI-assisted interactions into a single measurement framework, is becoming the standard for retailers serious about customer journey analytics.
The retailers who will win the next three years are not the ones with the highest satisfaction scores. They are the ones who can connect a drop in return intention in a specific store to a specific operational change within 72 hours.
My perspective on what most retailers get wrong
I have worked with retail organizations at various stages of their CX measurement maturity, and the pattern I see most often is not a lack of data. It is a lack of cross-departmental ownership.
Lack of visibility between departments causes experience erosion at exactly the seams where customer trust is most fragile. A service team that cannot see order fulfillment status cannot communicate proactively, and that silence reads to the customer as indifference. No satisfaction score captures that in real time.
What I have found is that predictive metrics only deliver value when they are owned, not just observed. Assigning a CX metric to a team without giving them the operational data to diagnose and act on it is theater. It looks like measurement. It produces nothing.
The other mistake I see frequently is building a CX scorecard for the C-suite rather than for the frontline. Executives need summary trends. Store managers need to know which three specific things to fix this week. Both views require the same underlying data, but they need to be surfaced differently.
My practical advice: start with measuring what moves commercially, build your scorecard around the metrics your CFO can trace to a revenue or cost line, and give your store teams real-time visibility into the signals that predict next-week behavior. That combination produces faster improvements, stronger internal buy-in, and a CX program that survives budget cycles.
— Daniela
How Altiamcx helps retailers act on CX data

Altiamcx works with retail organizations to move beyond measurement into operational execution. The Altiamcx performance framework connects VoC data, transactional signals, and real-time customer feedback into role-based dashboards that give store managers, operations leads, and executives exactly the view they need, at the right level of detail, at the right time.
Retailers working with Altiamcx have used these frameworks to reduce checkout friction, improve complaint resolution rates, and increase return-visit frequency across both physical and digital channels. The nearshore CX services Altiamcx provides combine cultural alignment with disciplined performance tracking, so CX metric improvements translate directly into measurable business outcomes rather than staying on a dashboard. If you are ready to build a CX measurement system that your finance team believes and your frontline can act on, explore what Altiamcx delivers for retail CX transformation.
FAQ
What is the role of CX metrics for retail?
CX metrics in retail connect customer experience signals to commercial outcomes like revenue, loyalty, and operational efficiency. The most effective metrics go beyond satisfaction scores to predict customer behavior, including return visits, churn risk, and purchase frequency.
Which CX metrics best predict retail customer loyalty?
NPS trend, Customer Effort Score, return intention, complaint resolution satisfaction, and loyalty program engagement together form a predictive set that identifies churn risk and revenue growth opportunities more reliably than standalone satisfaction scores.
How long does it take for CX metric improvements to show financial results?
Operational improvements such as reduced handle time appear in 4 to 8 weeks. Retention and revenue effects typically take 6 to 12 months. Full program ROI is a multi-year outcome that requires aligned leadership expectations from the start.
How do retailers connect CX metrics to P&L outcomes?
Linking CX metric improvements to specific operating costs, such as labor savings from faster checkout or reduced return rates from better product information, translates experience data into financial language that CFOs and operations leaders can approve and fund.
What role does AI play in retail CX measurement?
AI connects customer intelligence to measurable commercial outcomes by tracking purchase behavior and order frequency signals alongside traditional satisfaction data, giving retailers a more complete picture of how experience quality drives revenue.